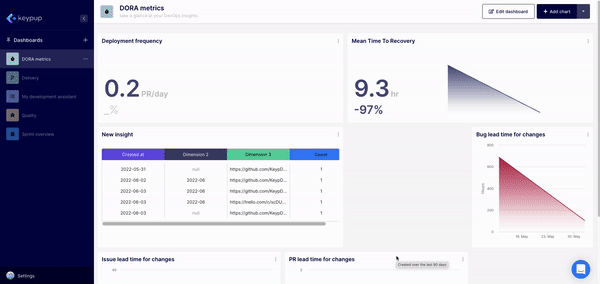
A dashboard is a user interface that provides a summary of key information populated from datasets. In Keypup, the dashboard is composed of multiple visualizations based on the user's needs. These visualizations can take the form of charts, KPIs, tables (reports), cards and boards.
Keypup's flexible interface allows you to customize, modify and enhance any existing tried-and-true template or to create your own dashboards starting from a blank canvas.
In this step-by-step tutorial, we will show you how to:
- Create a new dashboard
- Customize your dashboard
We will also:
- Define a few concepts allowing you to better understand the dashboard’s interface, components and properties.
- Introduce a graphical representation of the dashboard structure
Let’s get started!
How to create a new dashboard
To create a new dashboard, click on the (+) button located on the top left corner of the screen in the navigation bar. Give your dashboard a name and click on the “Create” button to save it.
Once created, your new dashboard is automatically pinned on your navigation bar on the left hand side of the screen, sorted by alphabetical order and you are automatically redirected to it.
Now that you’ve created your dashboard, by default, you will access it in “viewer mode”.
How to customize your dashboard
To bring your dashboard to life, you will need to add a few components (insight widgets) and organize them onto the layout (canvas).
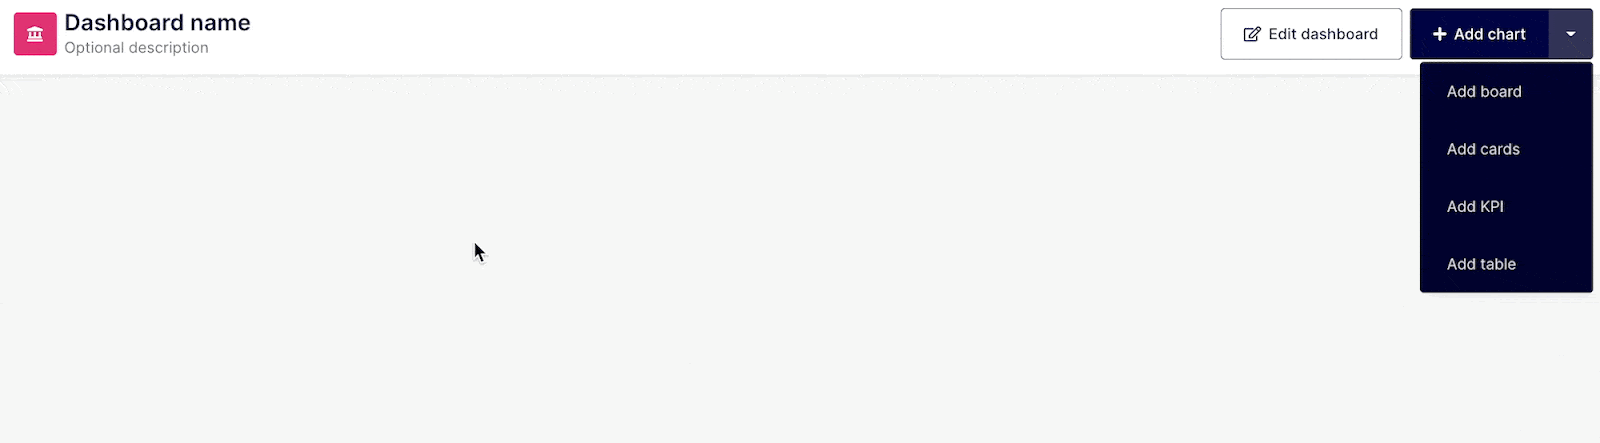
Components
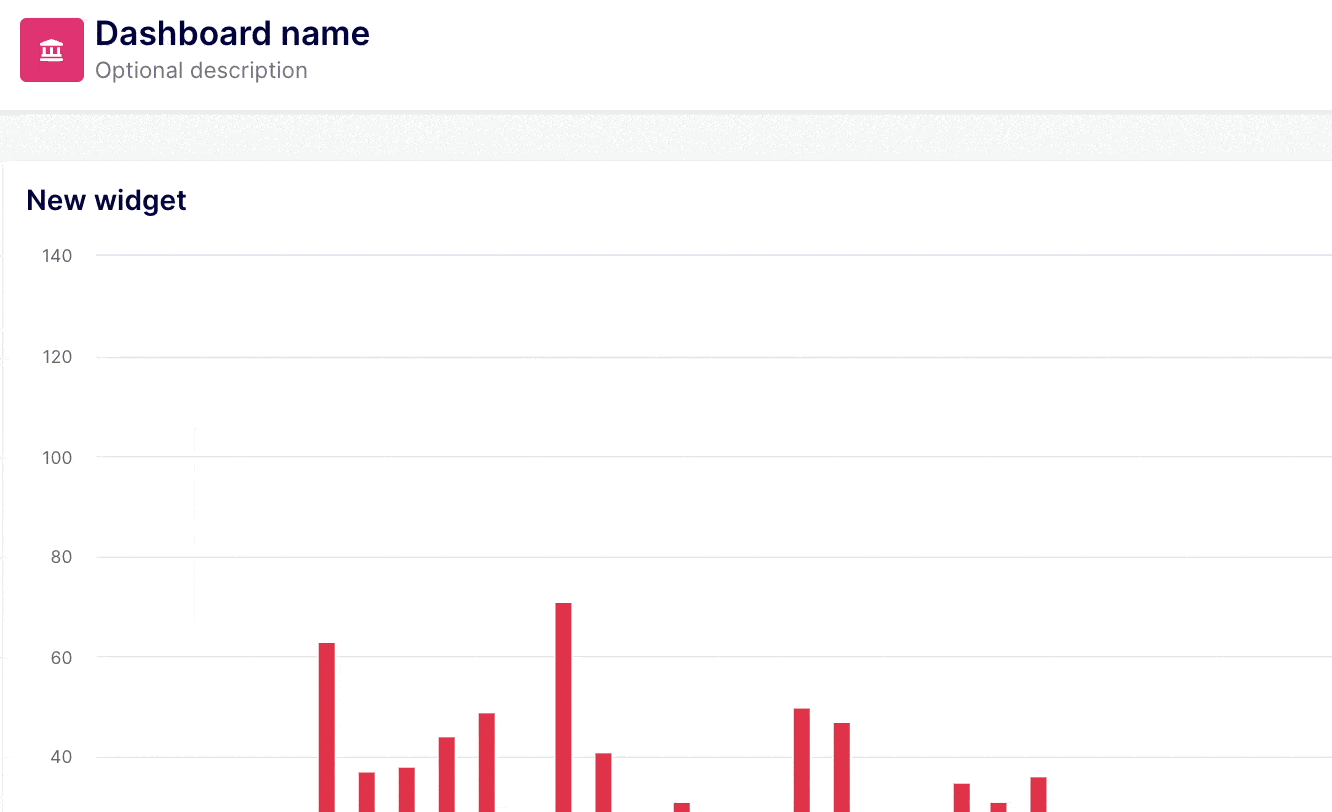
To add an insight widget to your dashboard, click on the “Add chart” drop-down menu and select the visualization you would like to configure. You can add a chart, table, KPI, board or card. Your insight widgets are placed by default after the previously created one, but we will show you later on how you can easily organize them in the canvas. All insight widgets can be modified, resized or removed as needed.
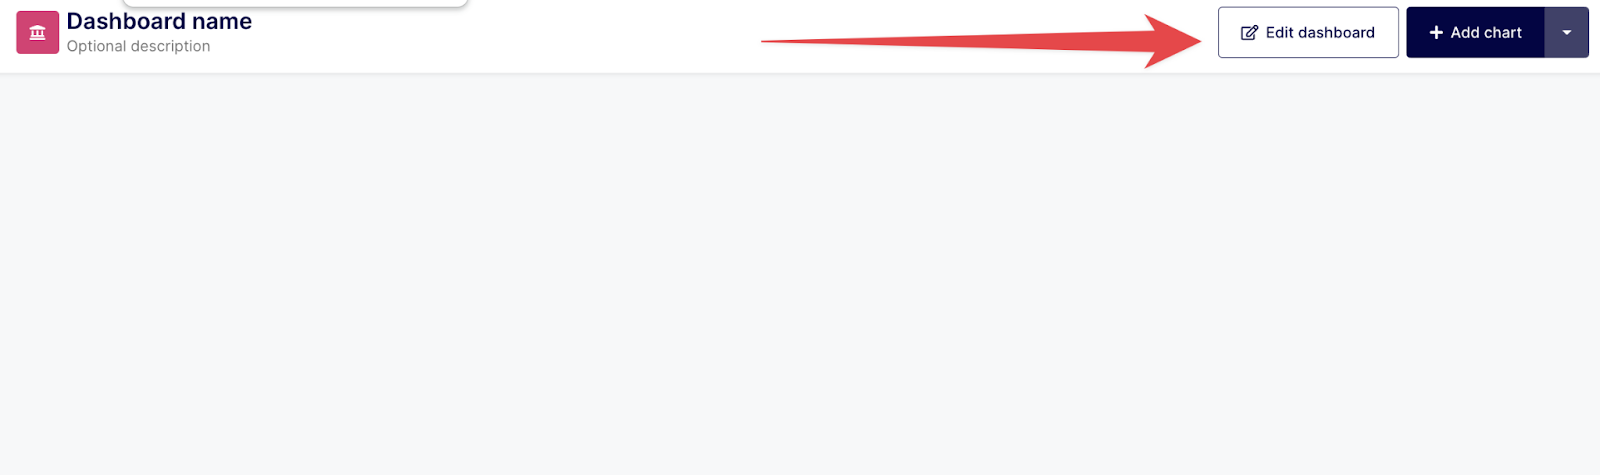
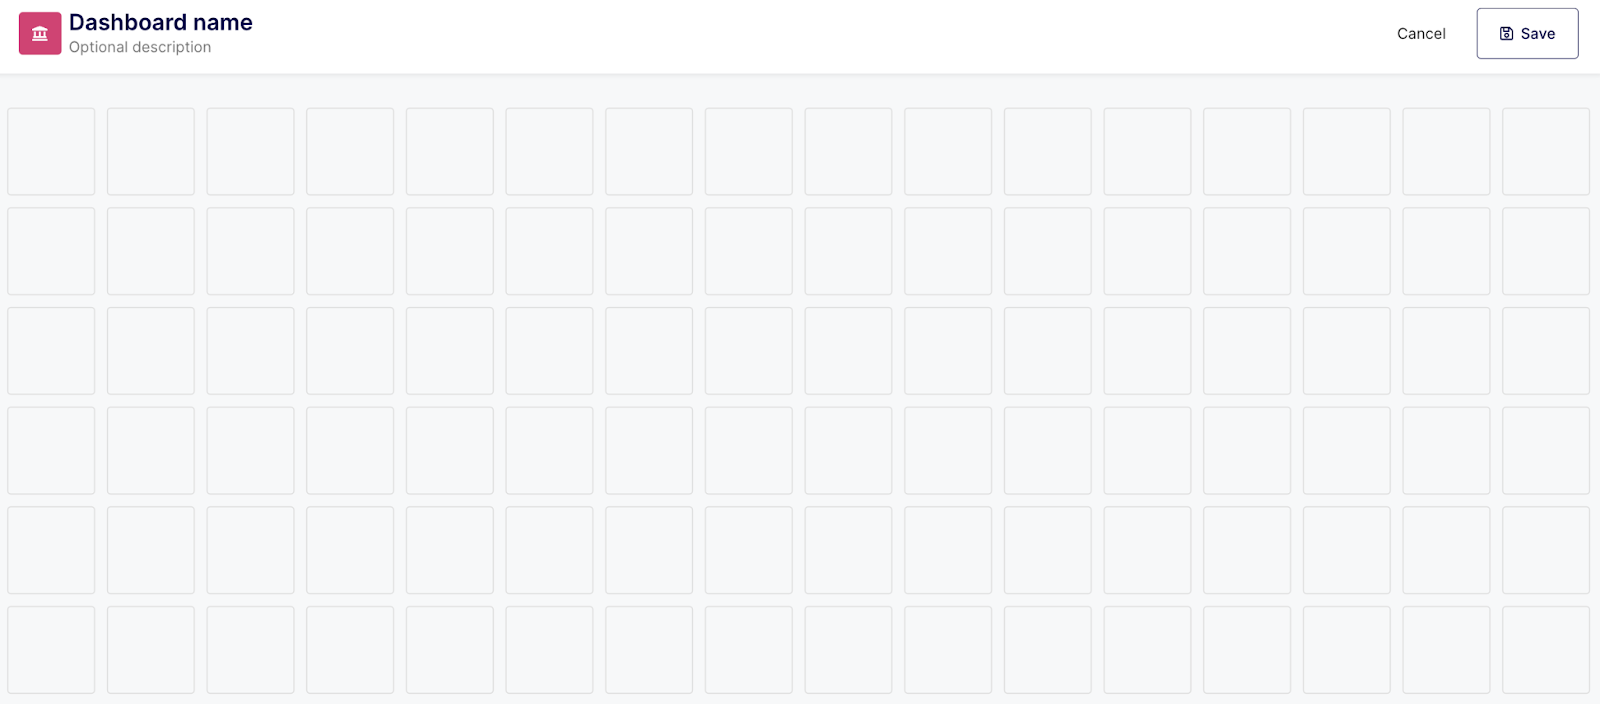
Canvas
The “designer mode” helps you organize your insight widgets onto the canvas. You can access it by clicking on the “Edit dashboard” button placed on the top right corner of your screen, next to the “Add chart” button.
The canvas is made of 16 cells, on which any insight widget can be placed and resized. Even though we do not limit its height, we recommend to consider narrower screens and avoid creating a dashboard longer than 12 cells.
Dashboard properties
To further personalize your dashboard, you can customize the following elements:
- The description (optional): you can add a description of your dashboard in “Designer mode” just below the title. While it’s optional, we recommend you to add a meaningful description for other users’ readability purposes.
- The dedicated icon and its color (optional): next to the title, you can also modify the icon image (25 options) and its color (33 options).
Once you are happy with your dashboard press the Save button located on the top right corner of your screen.
Any suggestion? Email us at contact@keypup.io or ping us via the chat.