Replicate your top performers
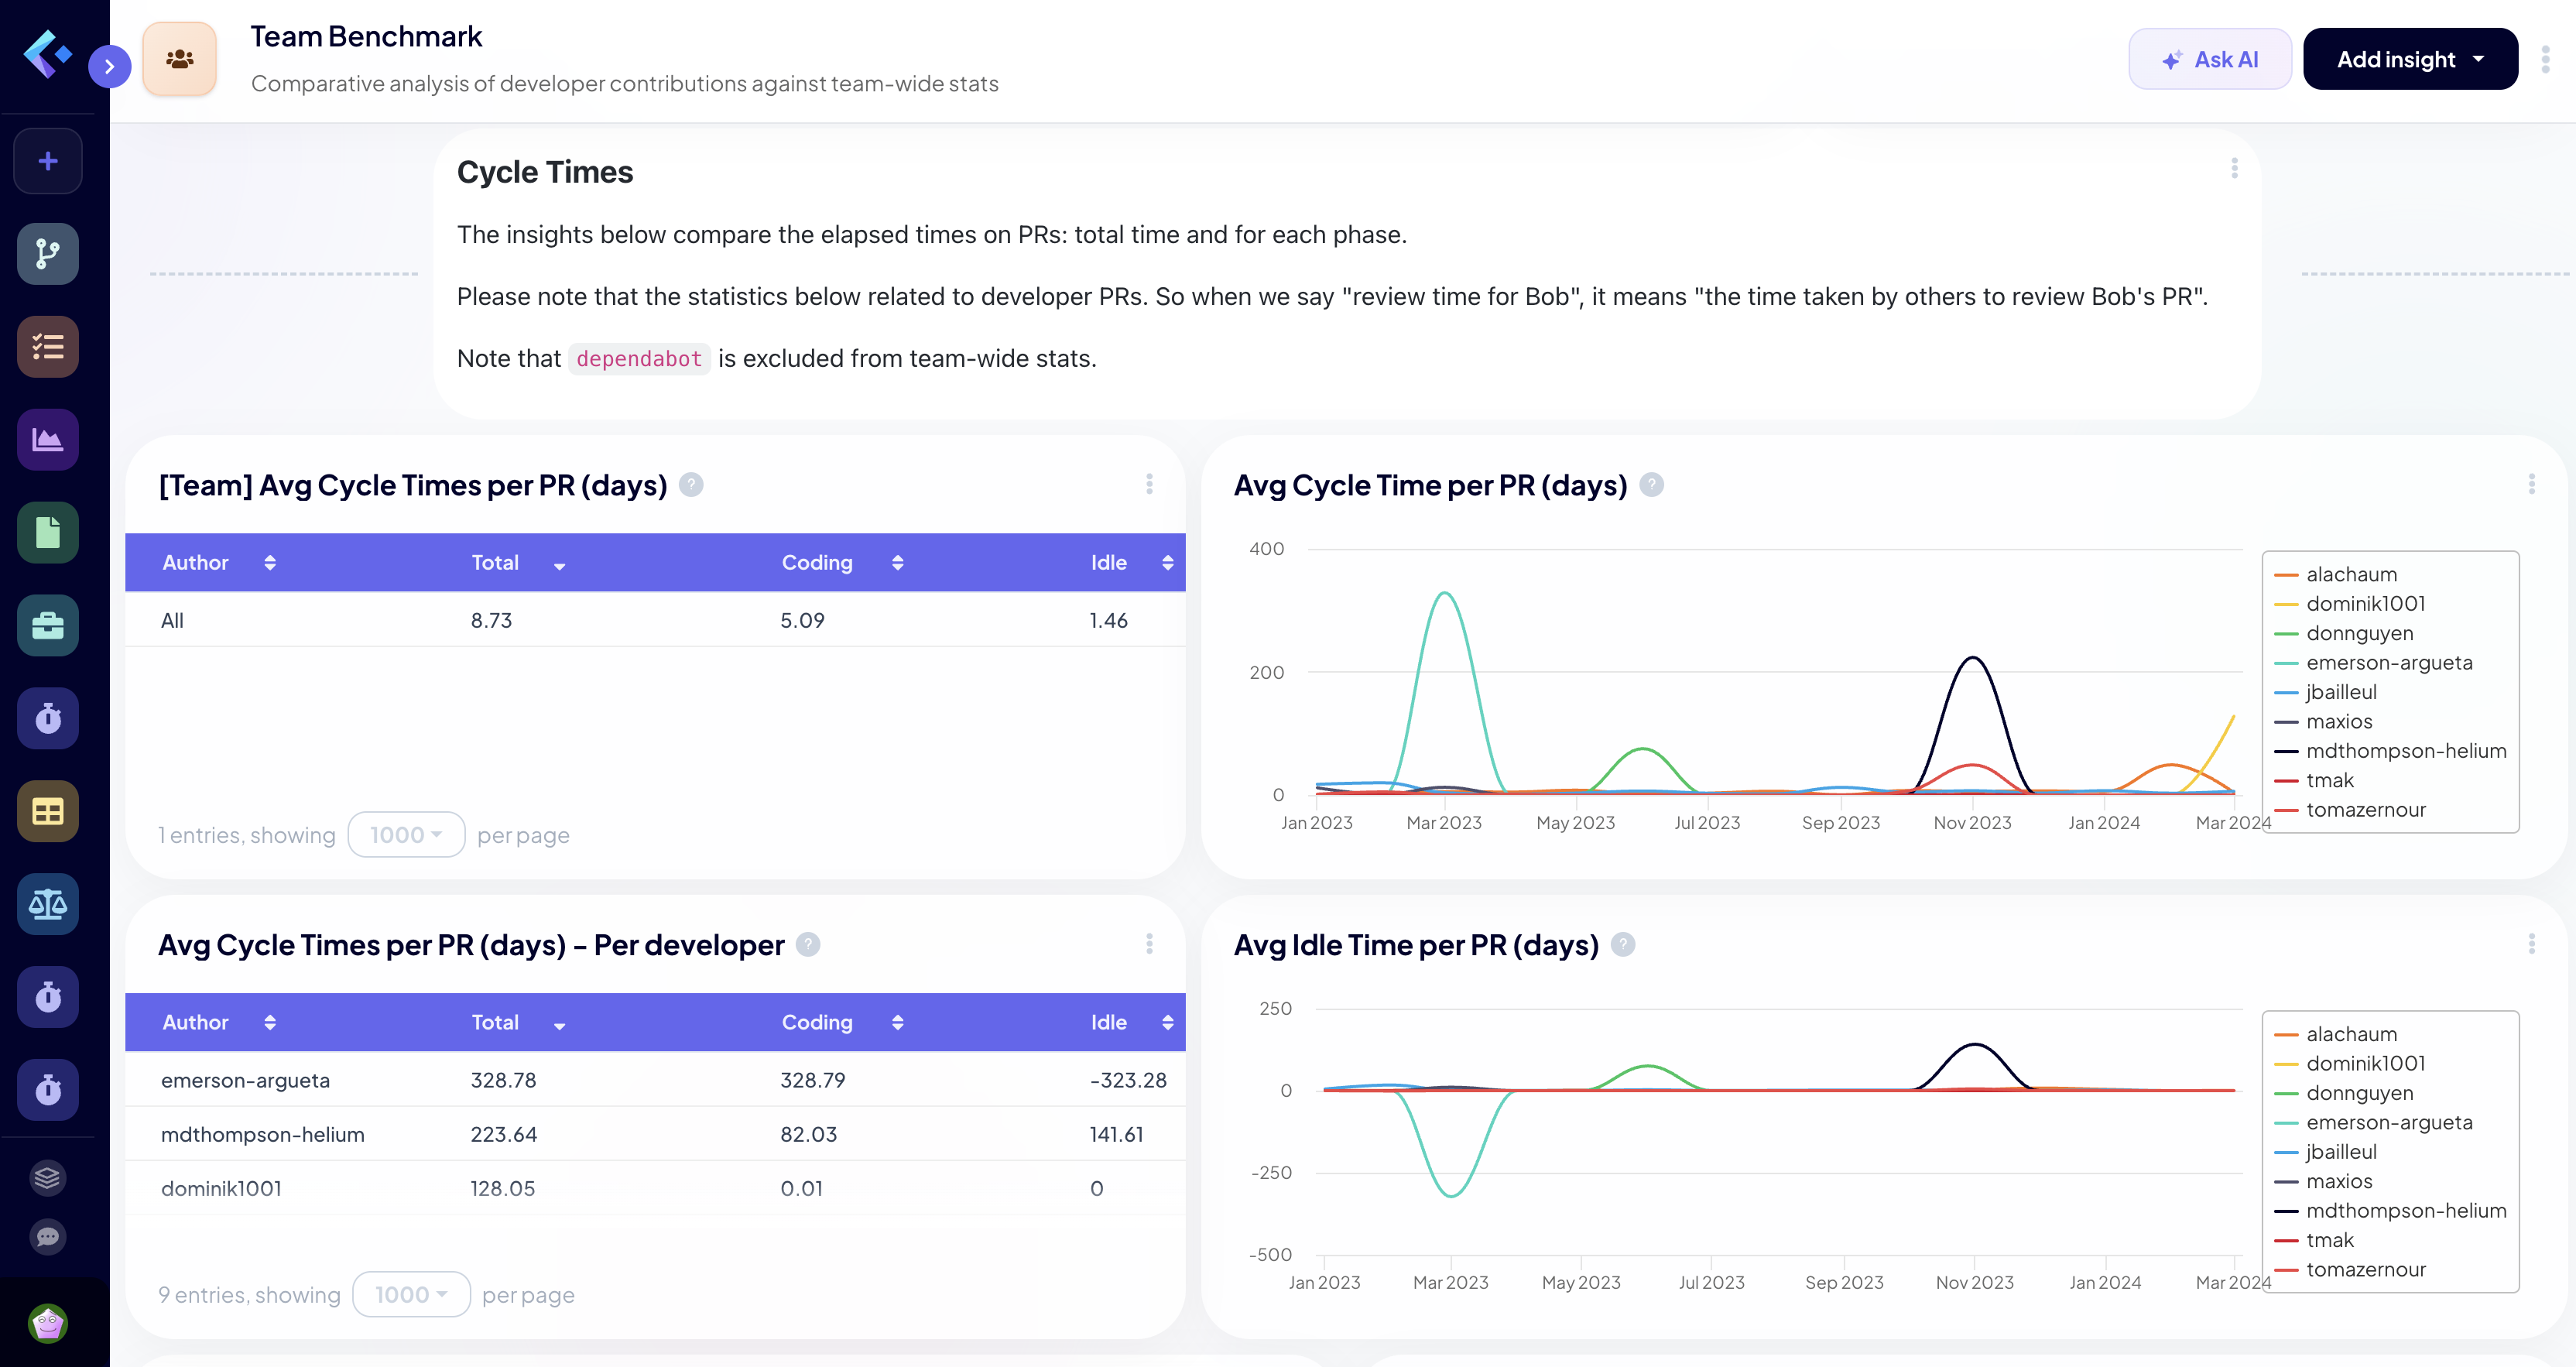
Objectively benchmark teams against each other. Identify specific habits—from PR size to review speed—and scale them across the org.
Manage your entire SDLC with plain English. Our autonomous AI agent generates multi-insight dashboards, deeply analyzes bottlenecks, and prescribes automated improvement actions in seconds.

Everything you need to rapidly benchmark performance and improve team health in one view.
Objectively benchmark teams against each other. Identify specific habits—from PR size to review speed—and scale them across the org.
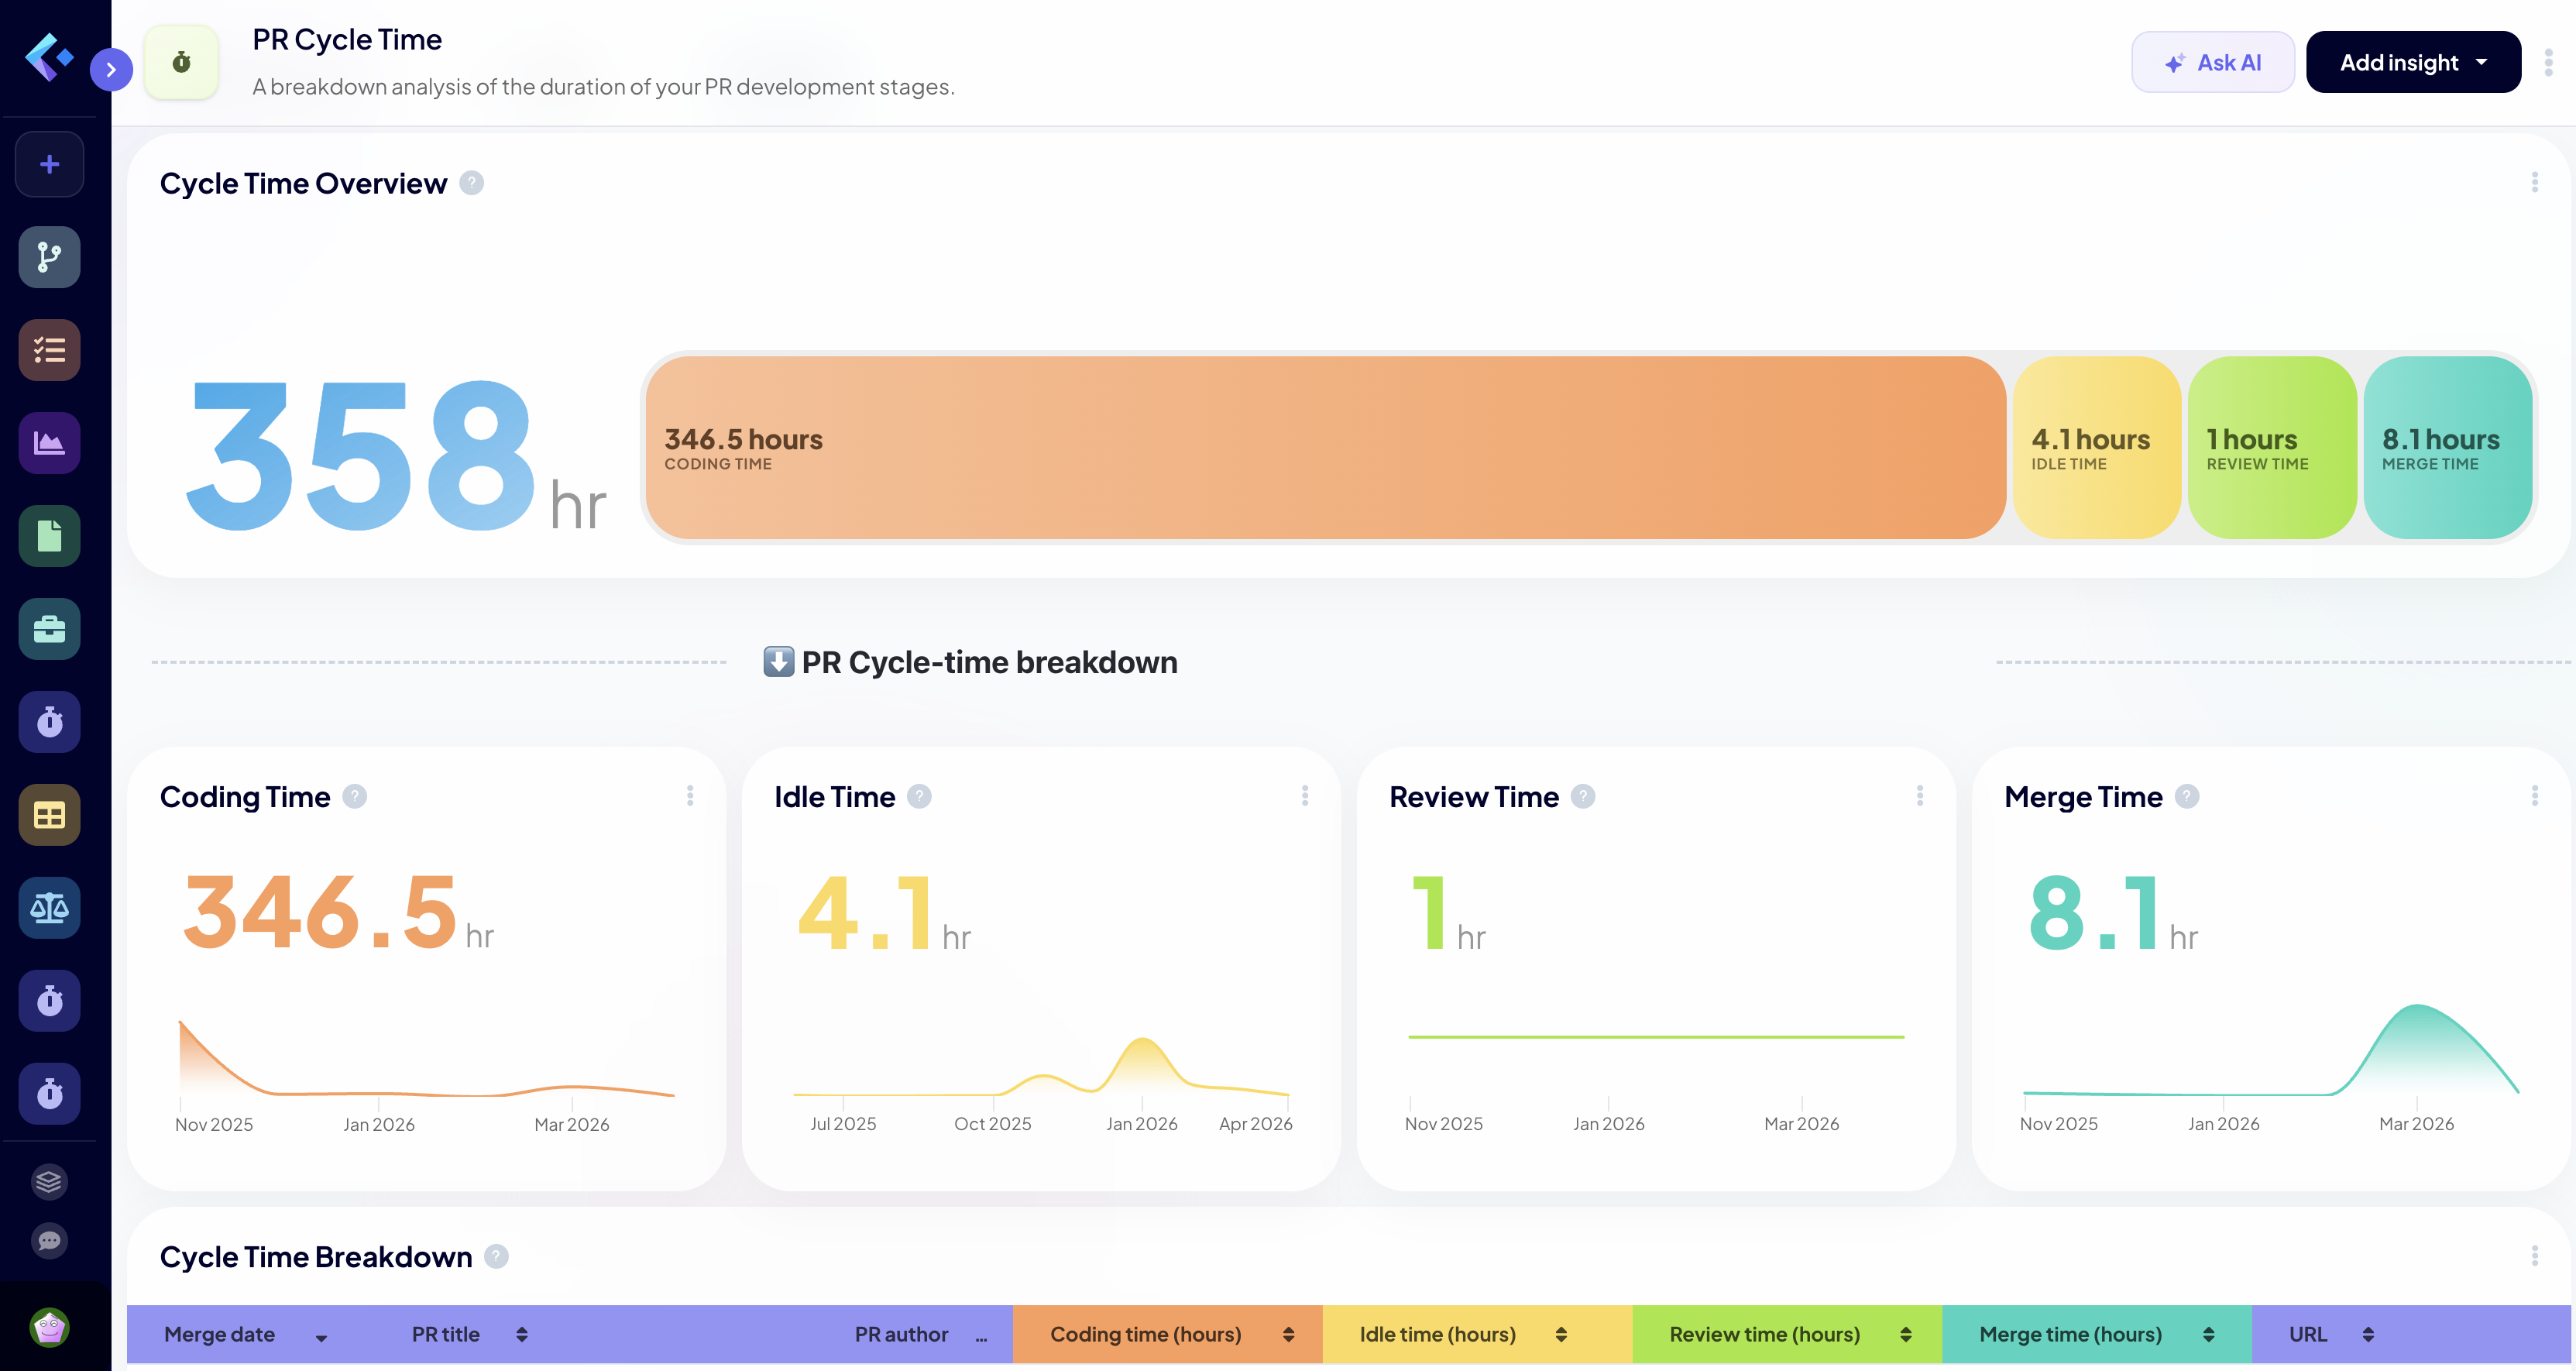
Eliminate bottlenecks. Identify where work stalls—slow reviews or long QA cycles—and deliver with greater predictability.
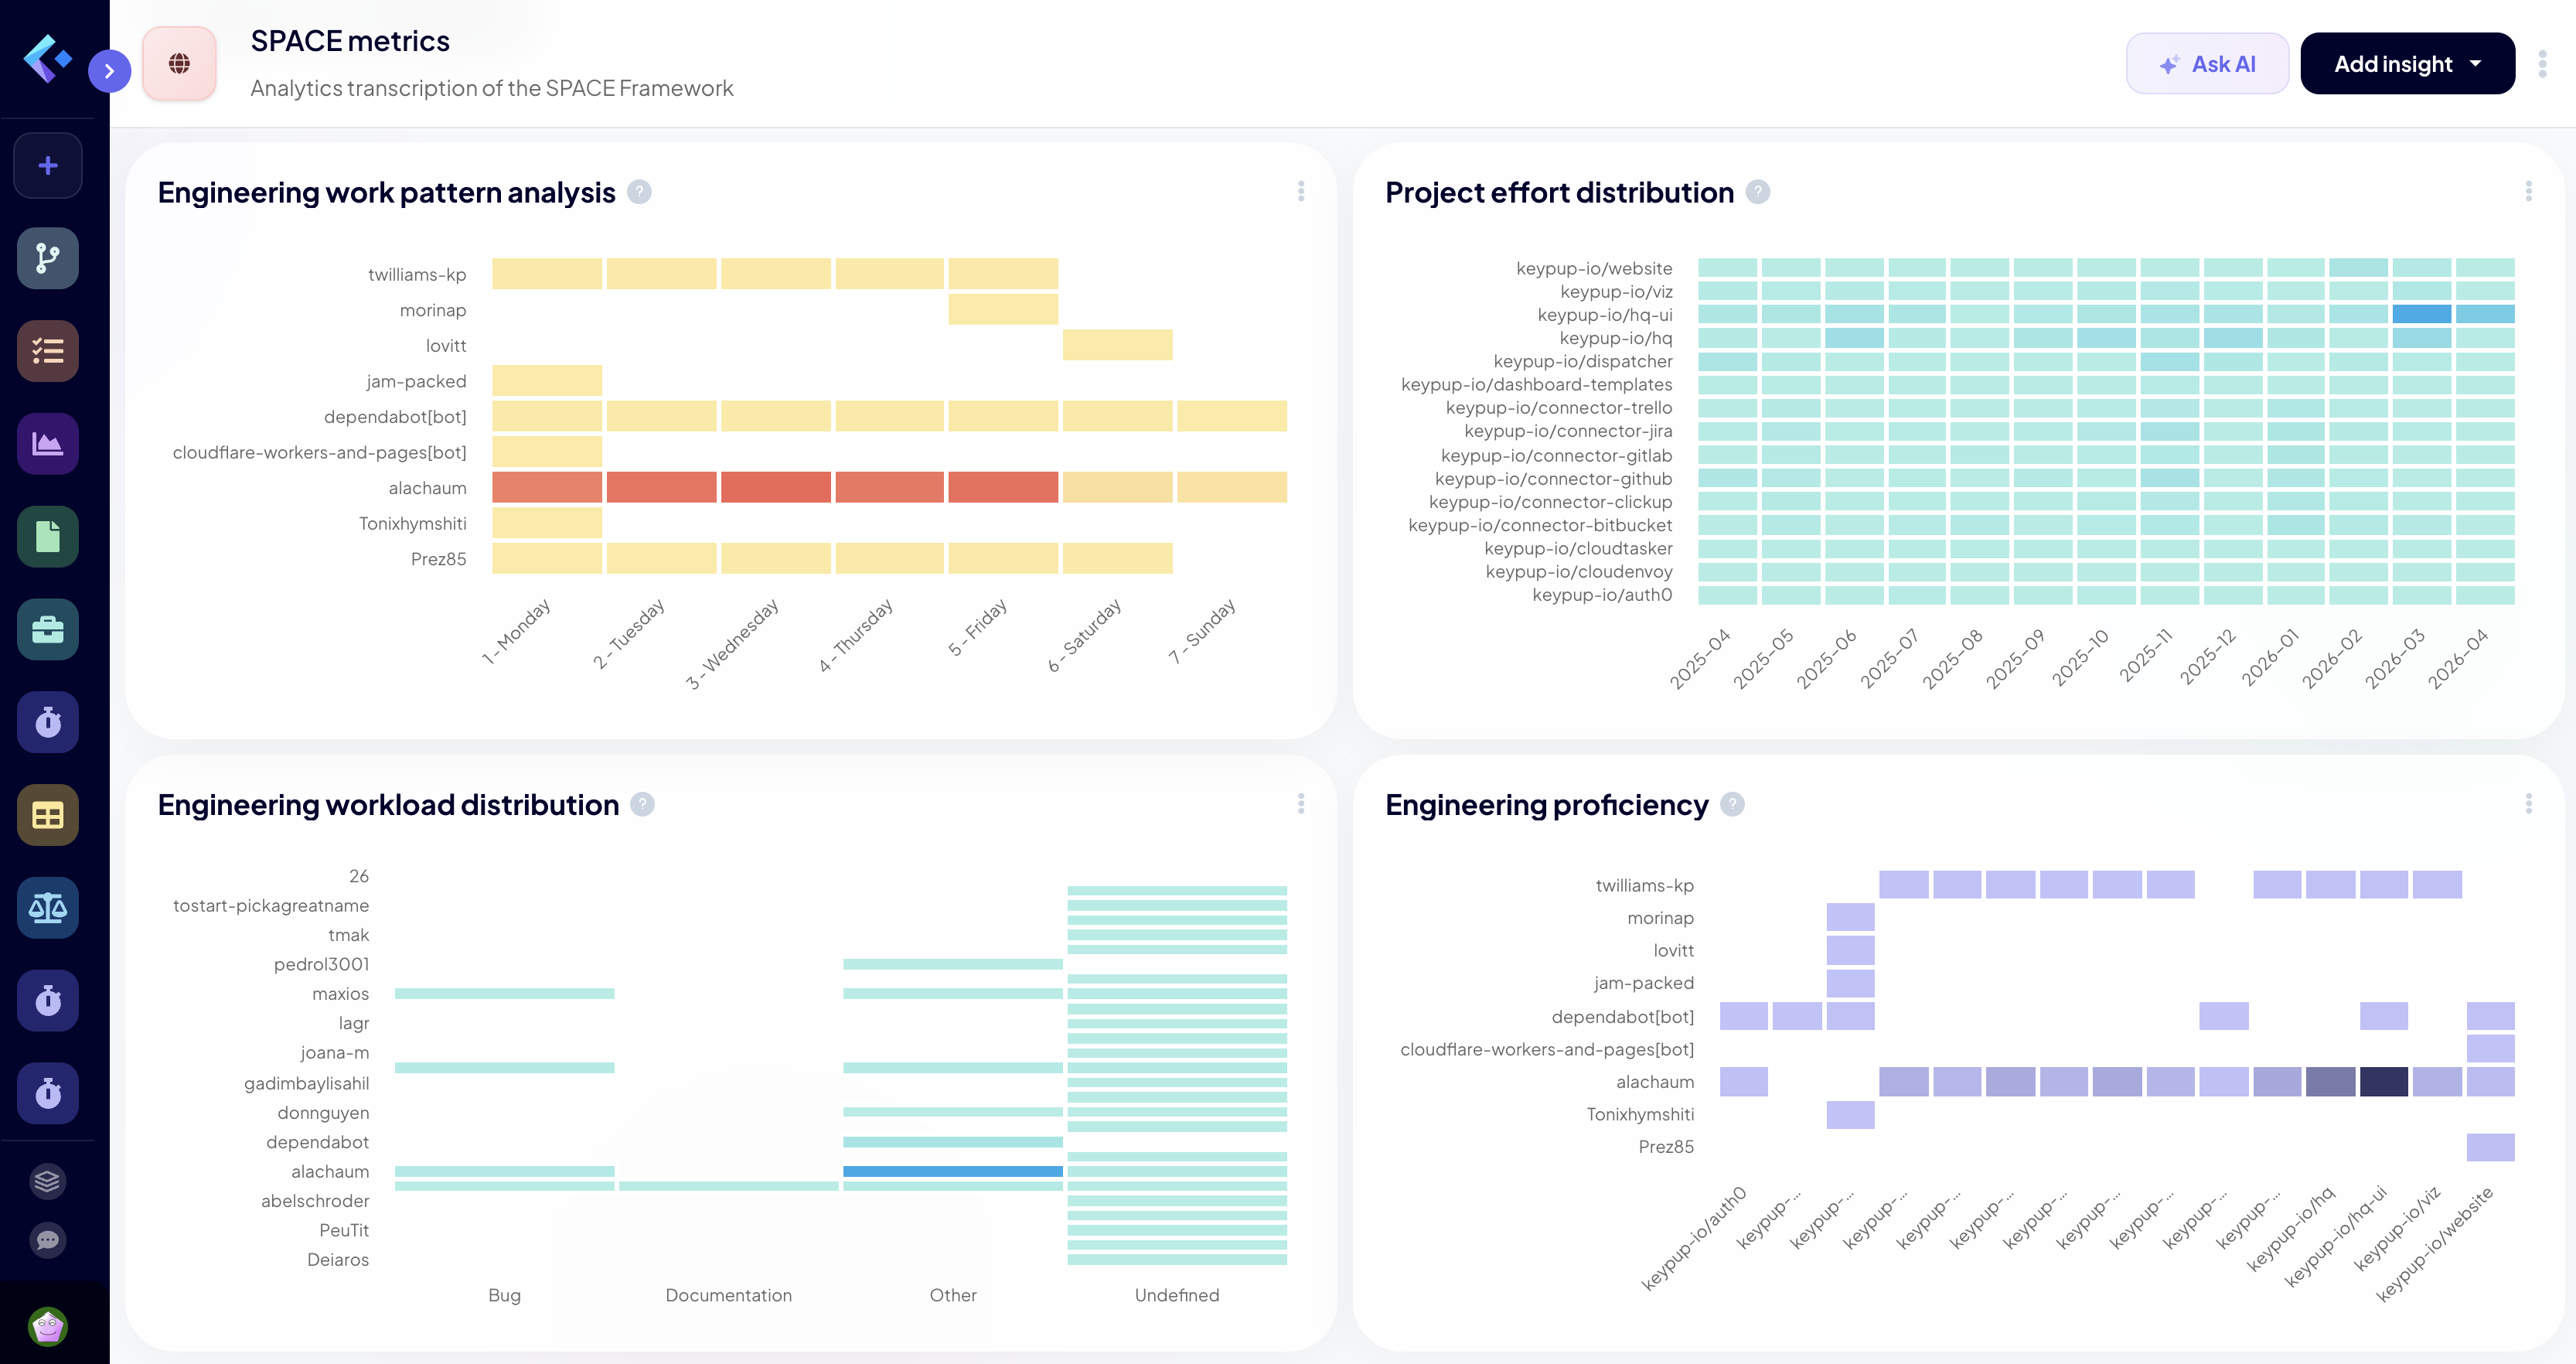
Bring the SPACE framework to life. Proactively address burnout and improve collaboration before it impacts delivery.
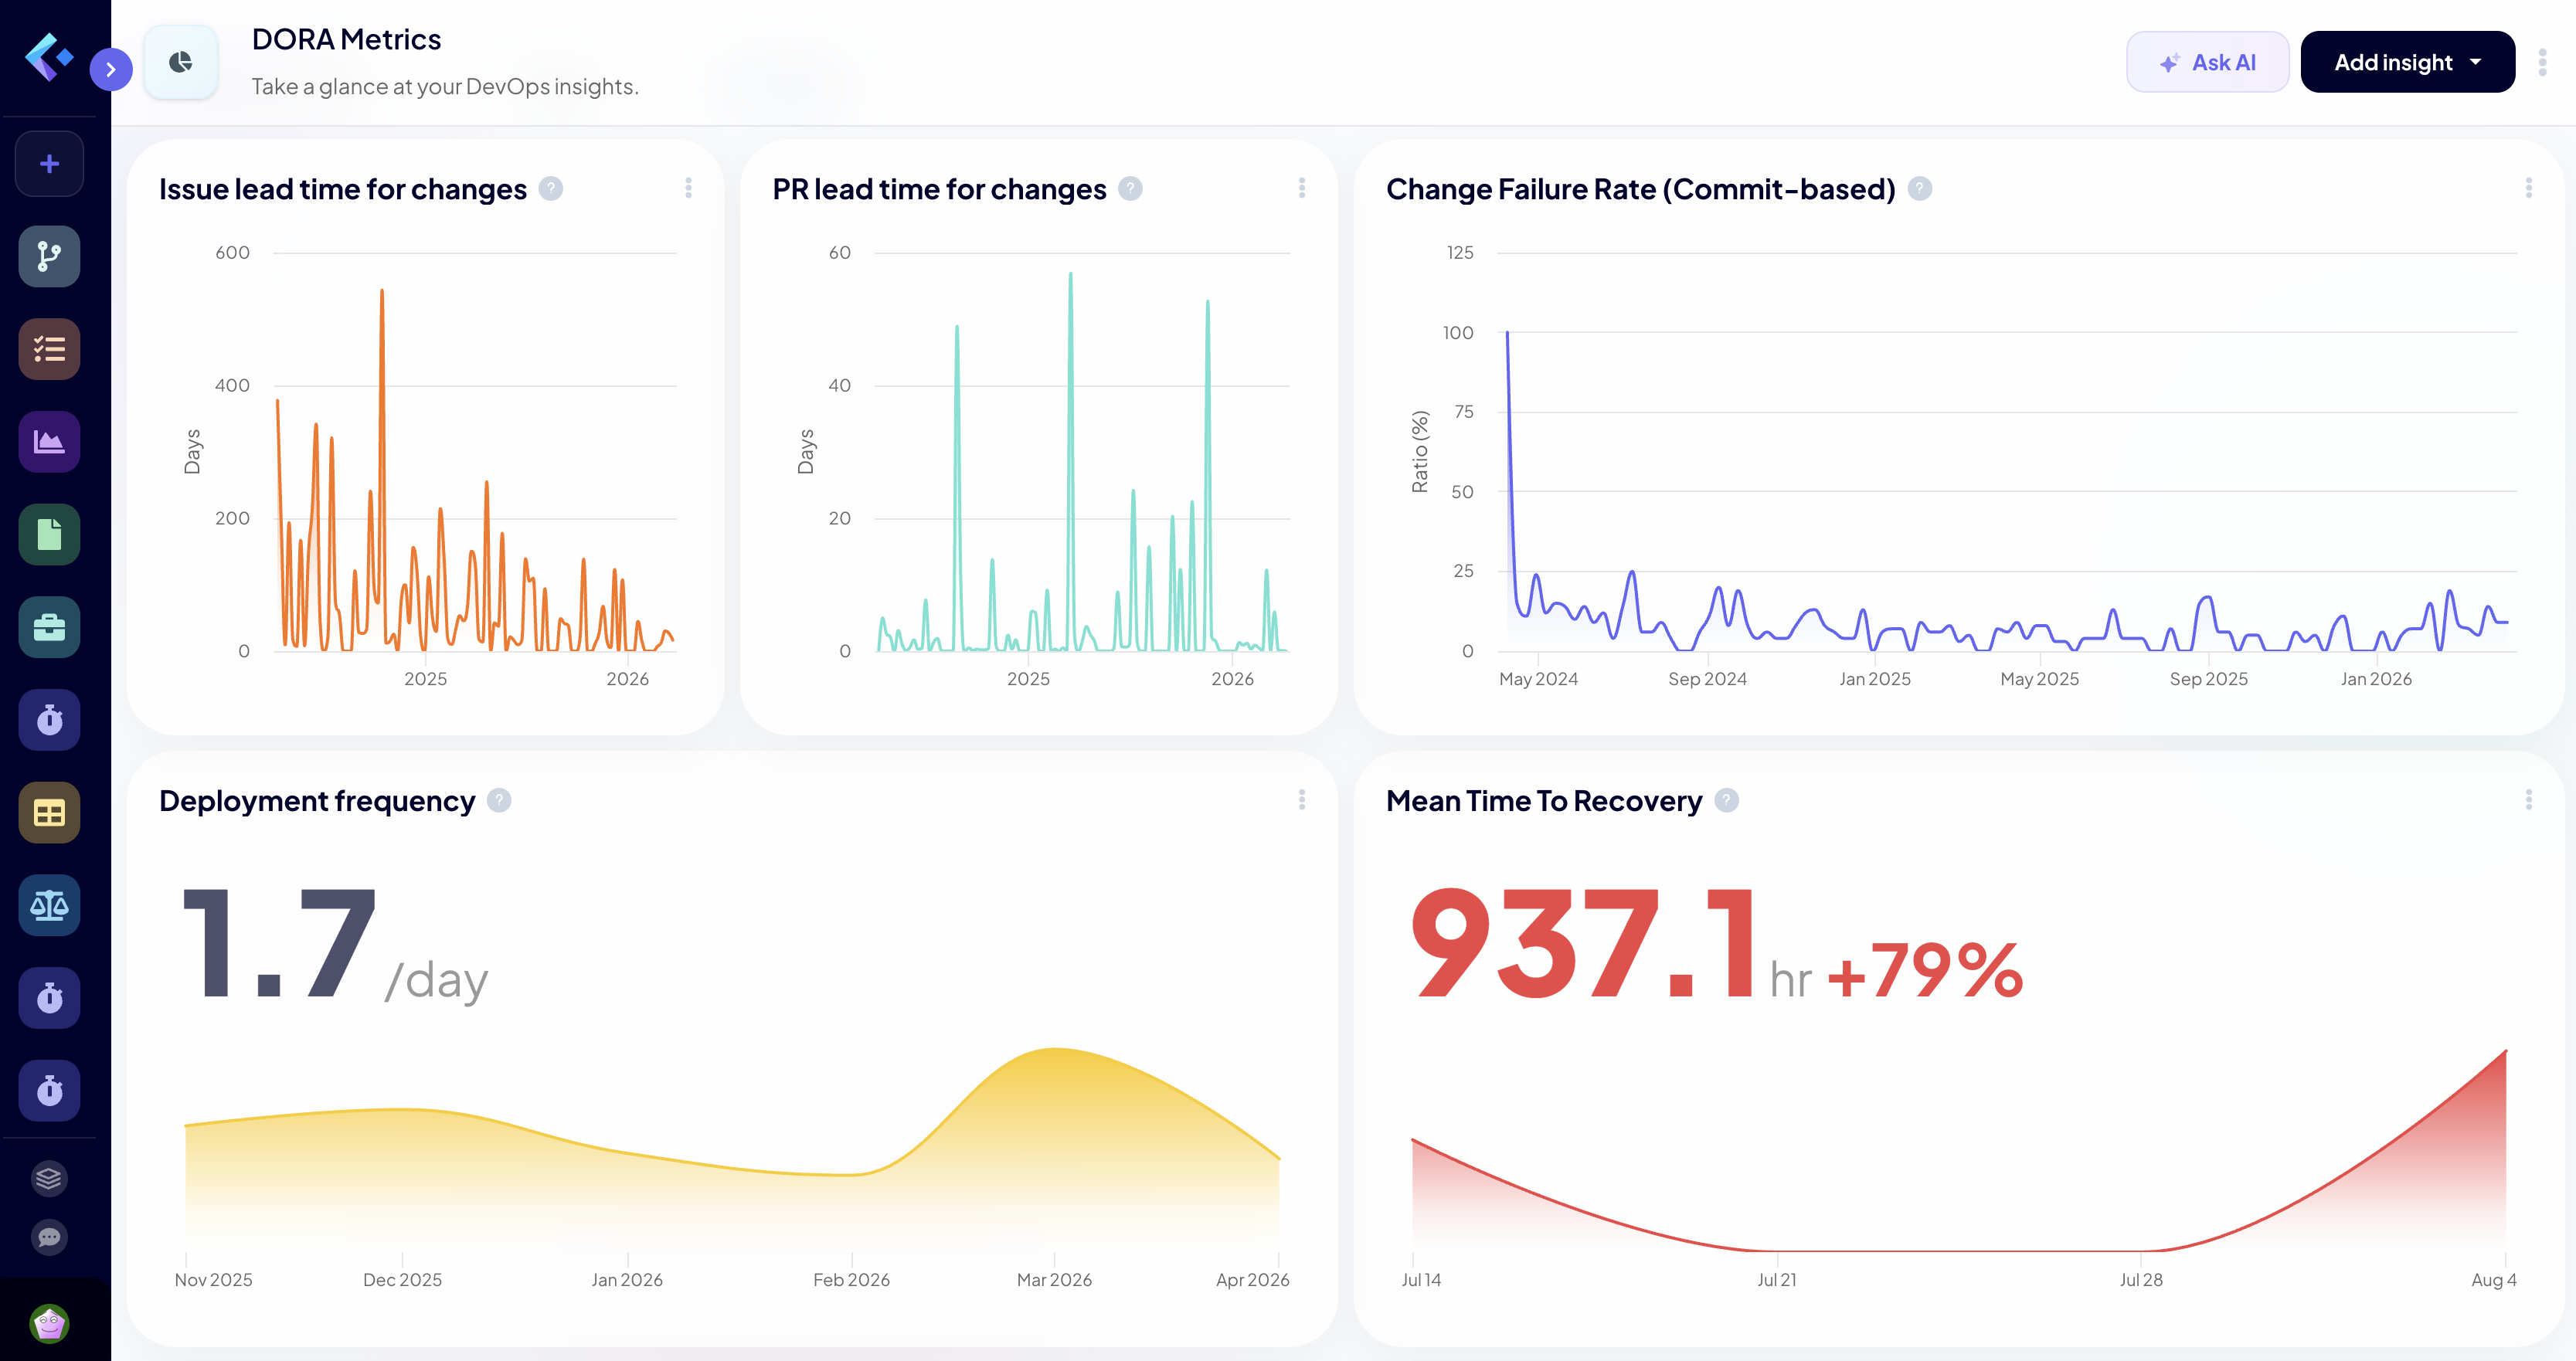
Stop guessing. Track DORA metrics in real-time: Deployment Frequency, Lead Time, Change Failure, and MTTR.
Stop wrestling with data extracts and complex queries. Ask plain English questions and get comprehensive visibility instantly. Keypup's General AI intuitively understands your setup—down to your custom Jira fields—delivering contextual analysis, automatic drill-downs, and actionable recommendations right out of the box.
Get started in minutes. No complex setup required.
Your development data is scattered. Keypup brings it all together. Instantly connect your Git repos, Jira, and other tools to create a single, unified view of your entire development lifecycle. This isn't just a data dump. It's an intelligent map of your team's performance.
Stop hunting for insights. Simply describe what you want to see. The AI Agent automatically constructs deep drilldowns, sets sprint cycles, and writes the documentation explaining what is being measured—all from a single prompt.
Your AI Agent narrates the story of your SDLC in plain English and suggests precise improvement actions. If you agree, it automatically creates a new tracking dashboard to monitor the success of your remediation over the next sprint.
Keypup adapts to your engineering reality, not the other way around.
Access all your metrics programmatically. Use the Keypup API to feed internal dashboards, trigger automations, or build custom developer portals.
Every team is different. Define your own logic—or let the AI formulate the precise calculation—to adjust lead times or exclude variables to match your reality.
Don't like the defaults? Tell the AI what you want. It builds custom charts, deep filters, and granular correlations instantly—no manual query builder required.
Give Claude, ChatGPT, Gemini CLI and other AI assistants instant access to your Keypup metrics. Ask questions in plain English and get real-time insights from your engineering data—right in your favorite AI tool.
See why modern development teams rely on Keypup to ship faster.
"Keypup allowed us to extract a lot of information from Github that would not be easily accessible otherwise. The support has been great, and the ability to get on a call and go through dashboards I've built has been very helpful in unlocking new possibilities to use the product. We now see what our engagement looks like between members and non-members, allowing us to better understand and interact with our community."
Read their story
"We increased our YoY productivity by 45% and Keypup helped us identify our pain points and change the game faster. Their support is the best – they helped us understand which metrics would suit our needs, built dashboards for us, and explained them in detail to us. With Keypup I can now say that we really manage our Engineering teams."
Read their story
"I was genuinely impressed with Keypup, not only because of the ease and speed of integration with our tools but also because it provided immediate access to DORA and other key customizable metrics. The standout was the customer support — they swiftly provided a personalized dashboard that enabled me to comprehend and compute real-time metrics with remarkable ease."
Read their story
"Keypup is a highly useful and practical platform, boasting
user-friendly features and lightning-fast report generation.
The service provided by customer support was excellent, showcasing
their dedication to customer satisfaction. We are delighted to be part
of the Keypup community."

Join thousands of developers and managers building better software.