
analytics
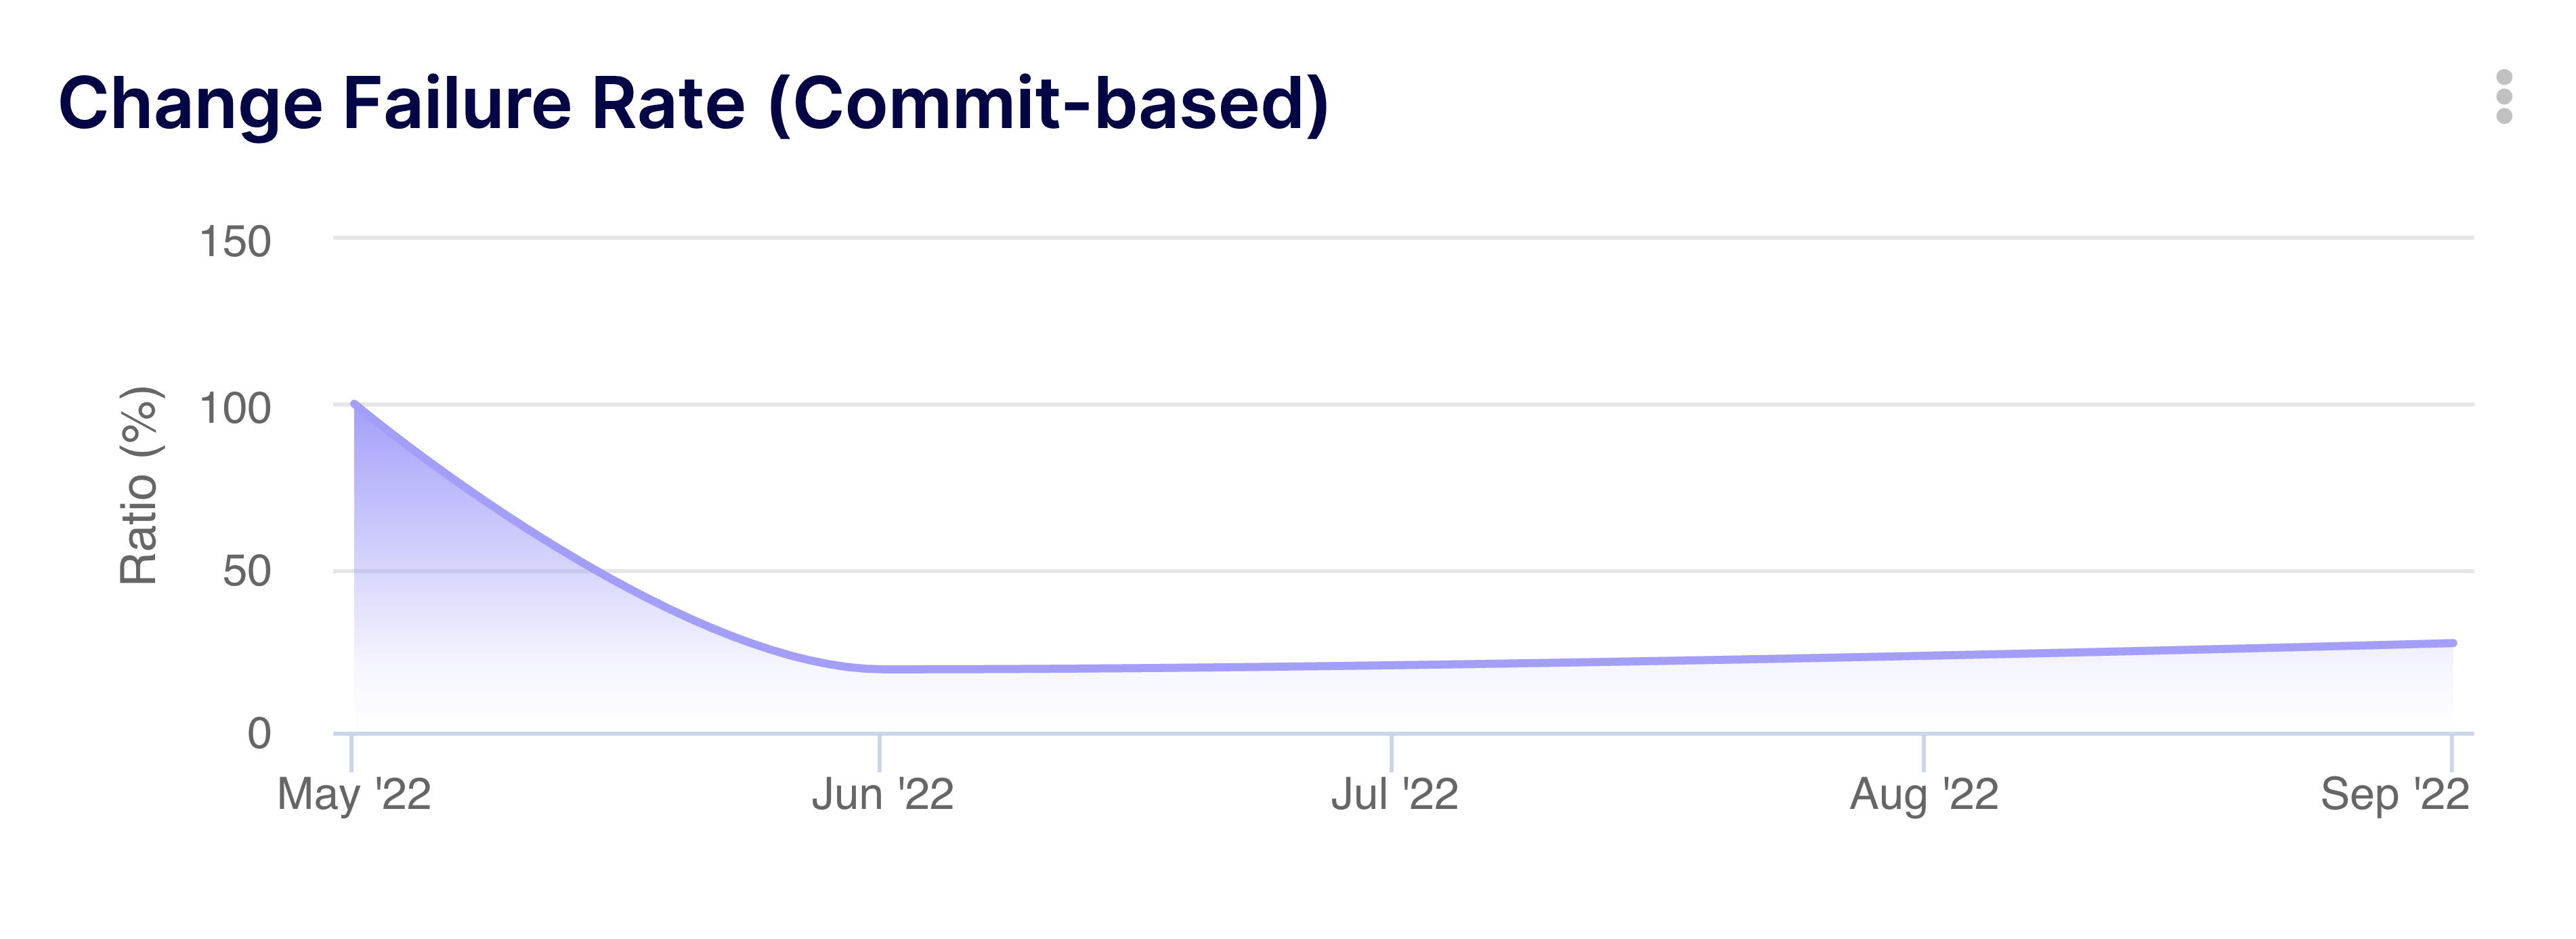
Change Failure Rate - Commits based
Measure the percentage of deployments resulting in failures based on fix commits.
Browse our curated collection of actionable insights. From DORA metrics to team health, find the exact formula you need to improve delivery.
Measure the percentage of deployments resulting in failures based on fix commits.
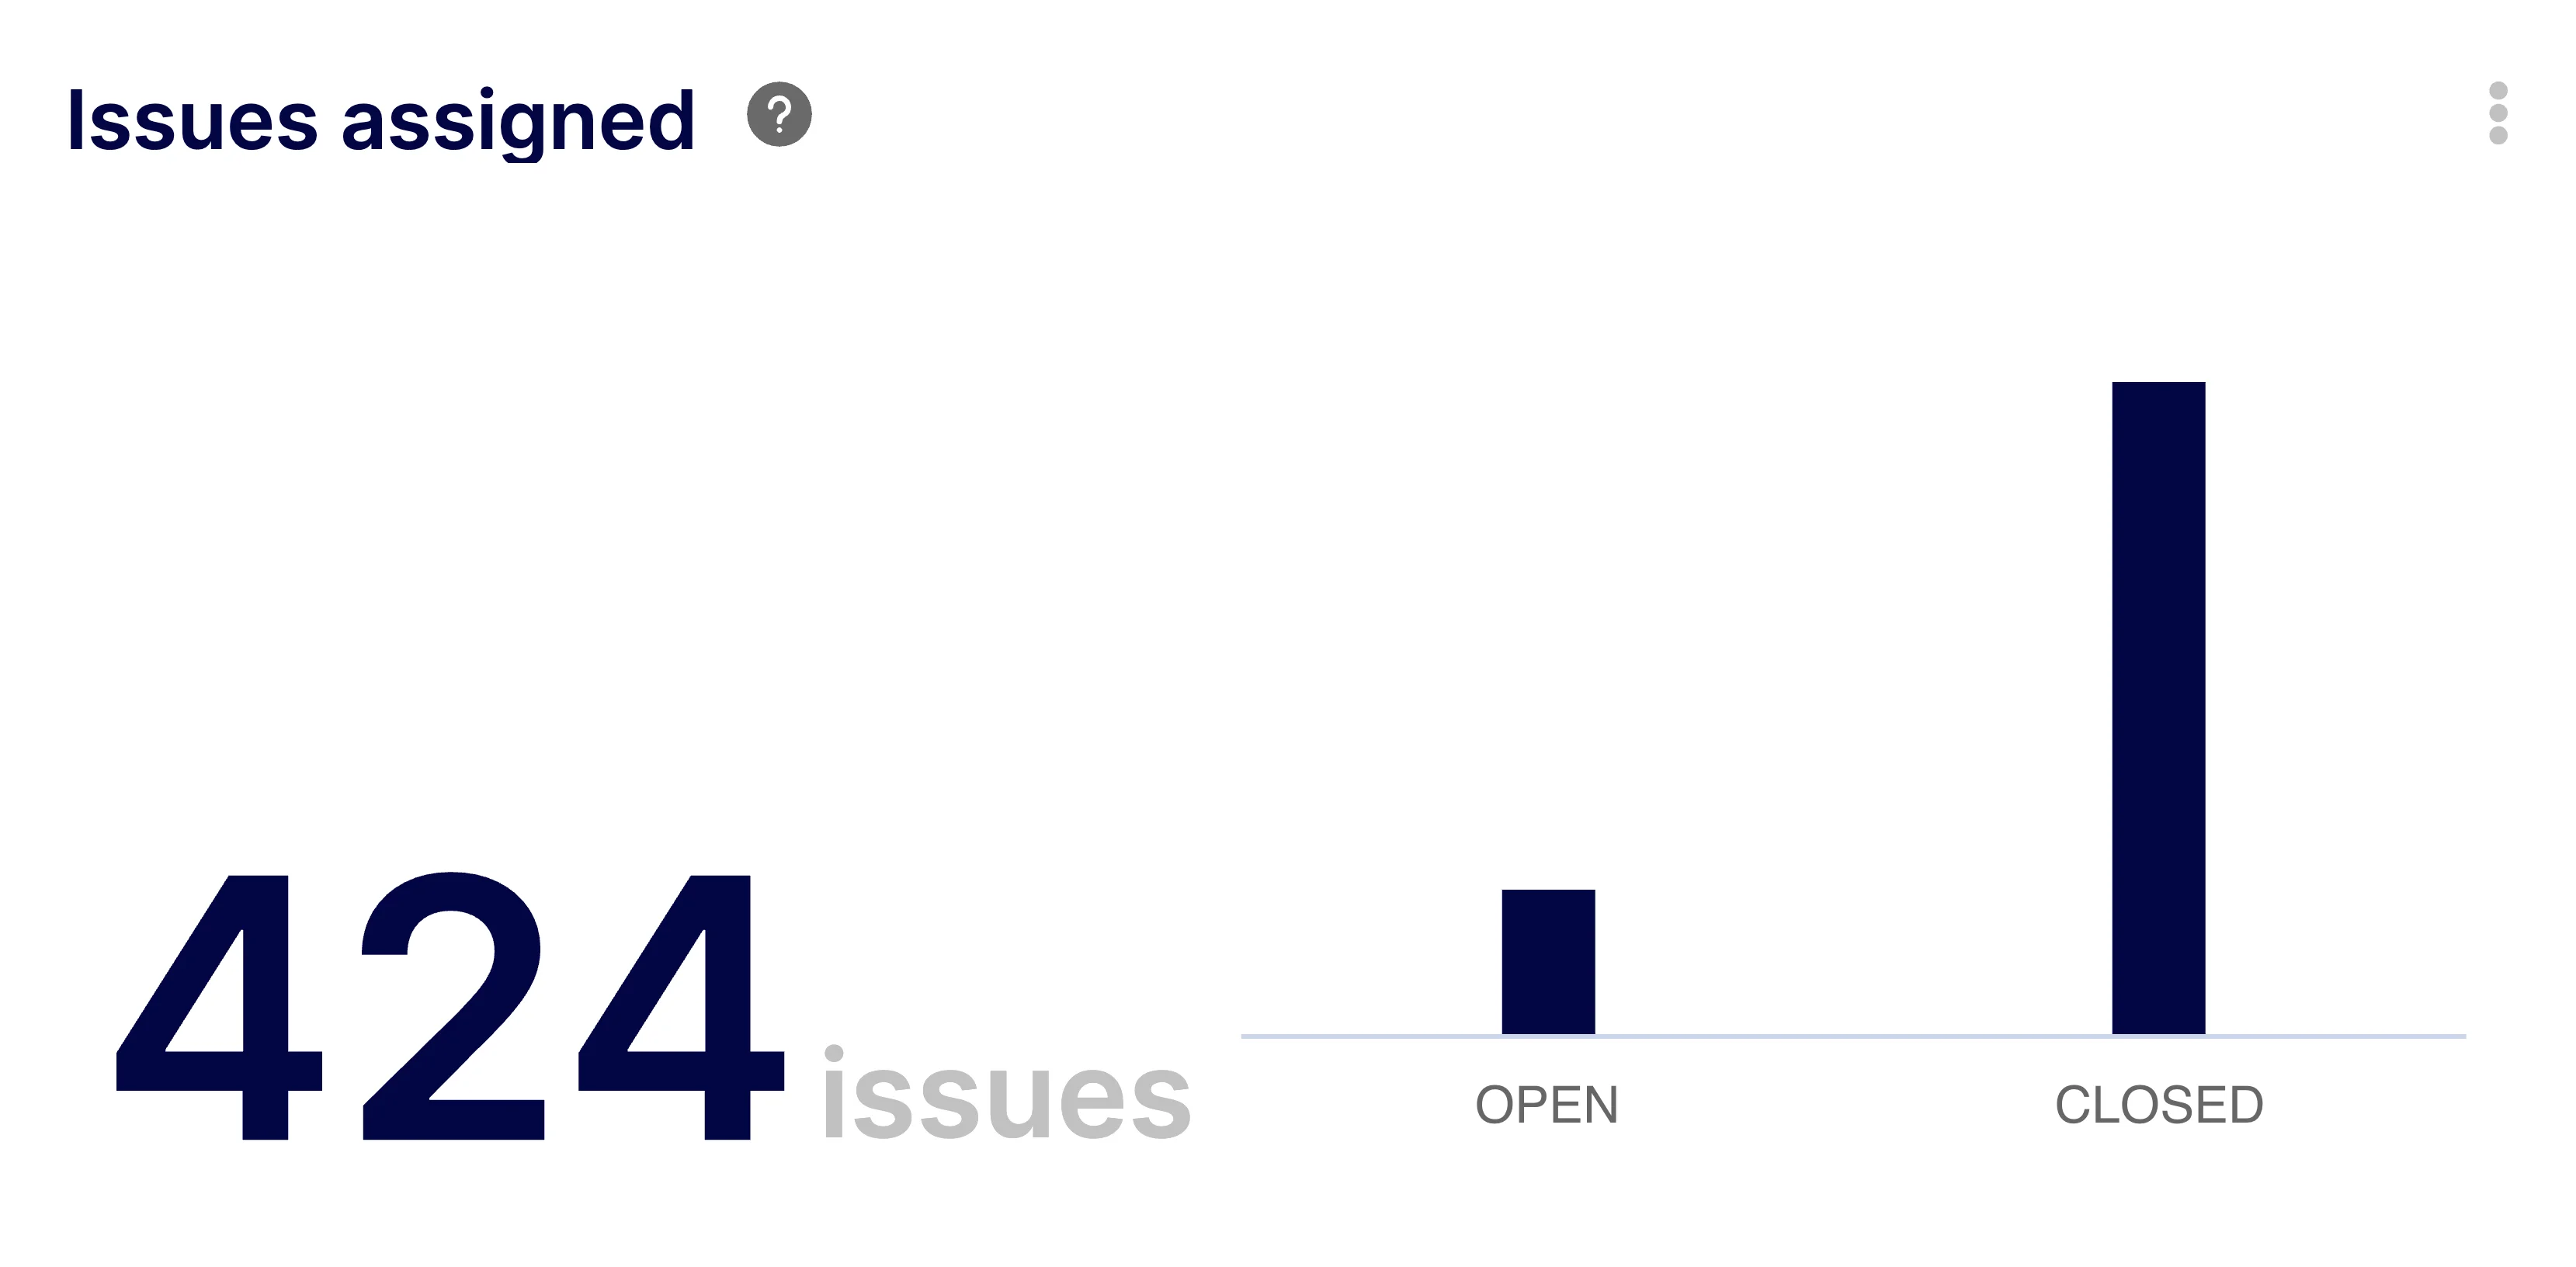
Track open and closed issues assigned to each team member to balance workload distribution.

Monitor code review assignments to ensure fair workload distribution across your engineering team.
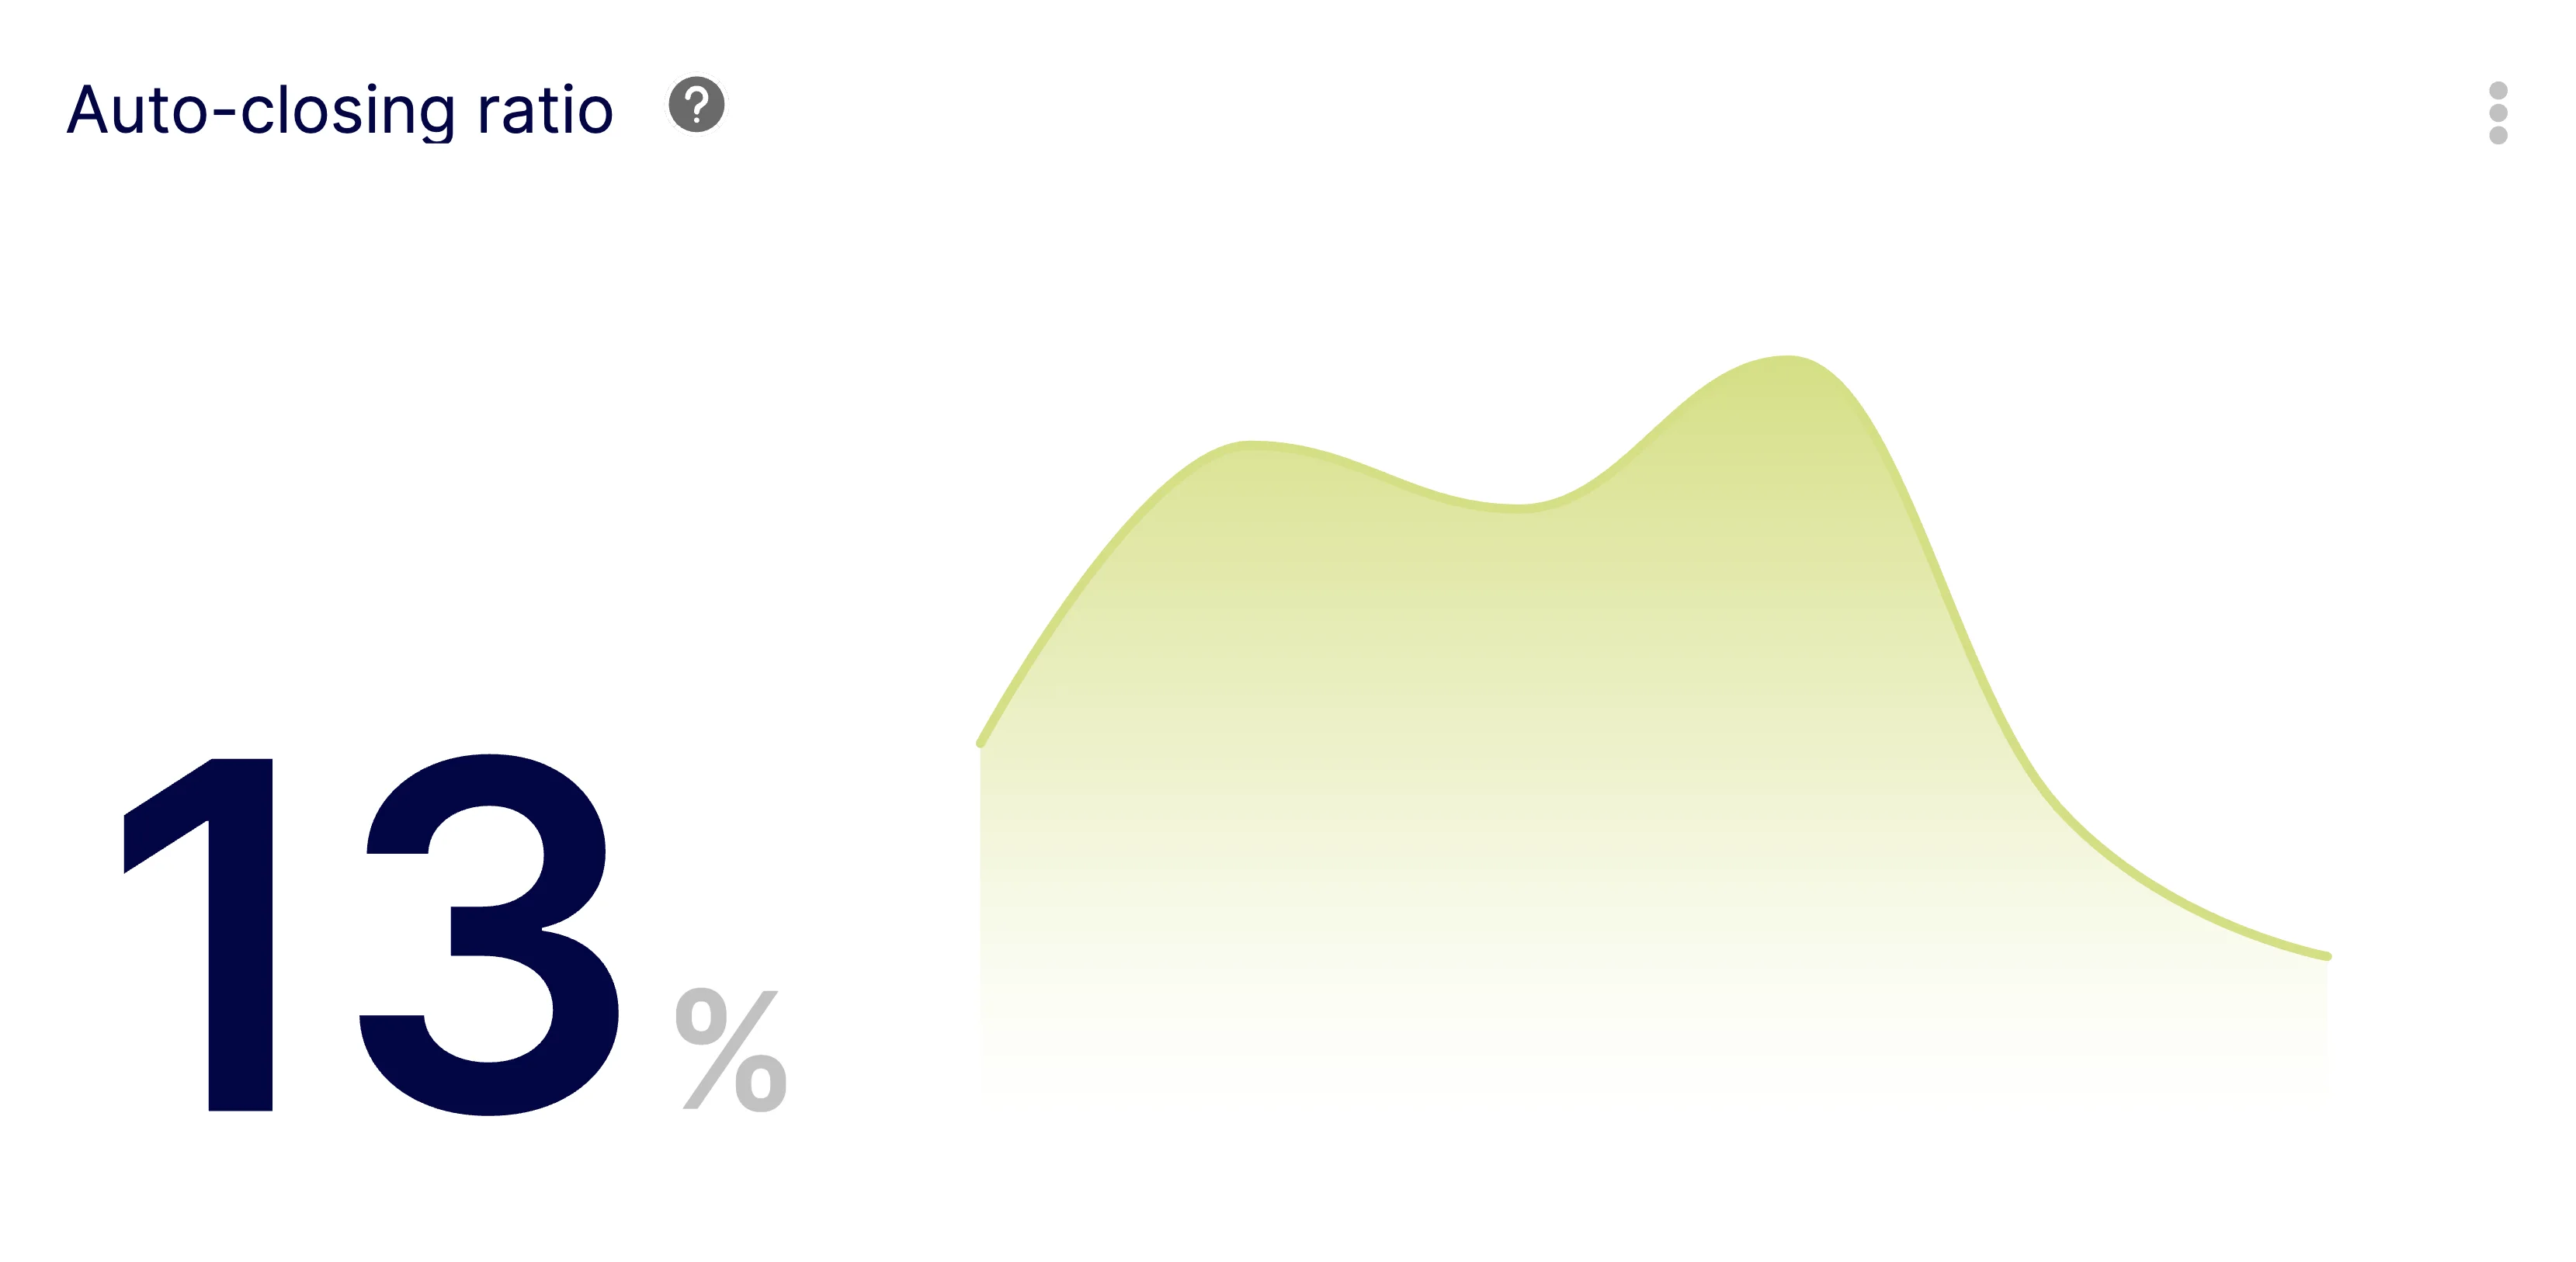
Measure how effectively your team links pull requests to issues to maintain a clean development history.
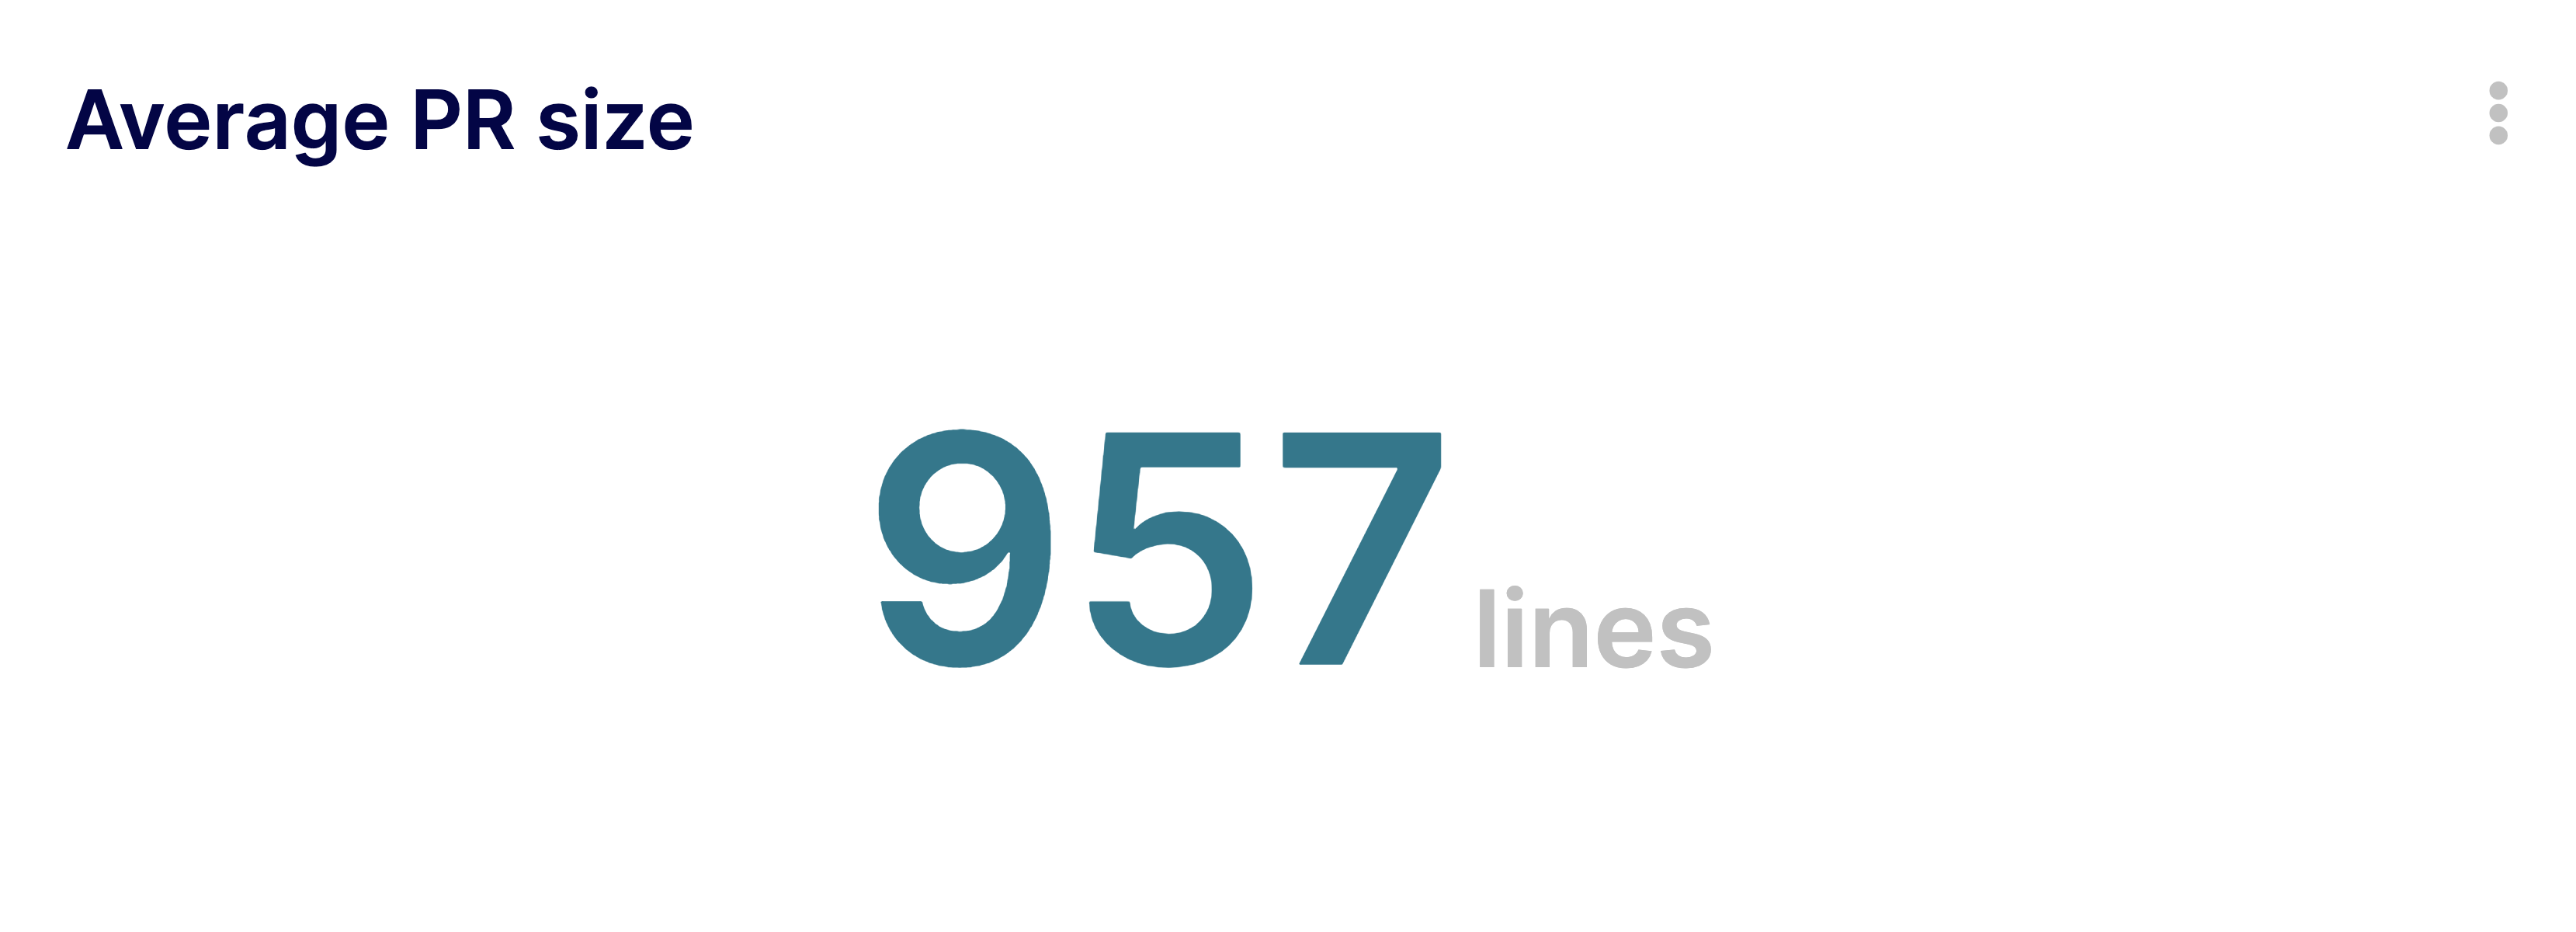
Track the average size of pull requests to encourage smaller, more manageable code contributions.
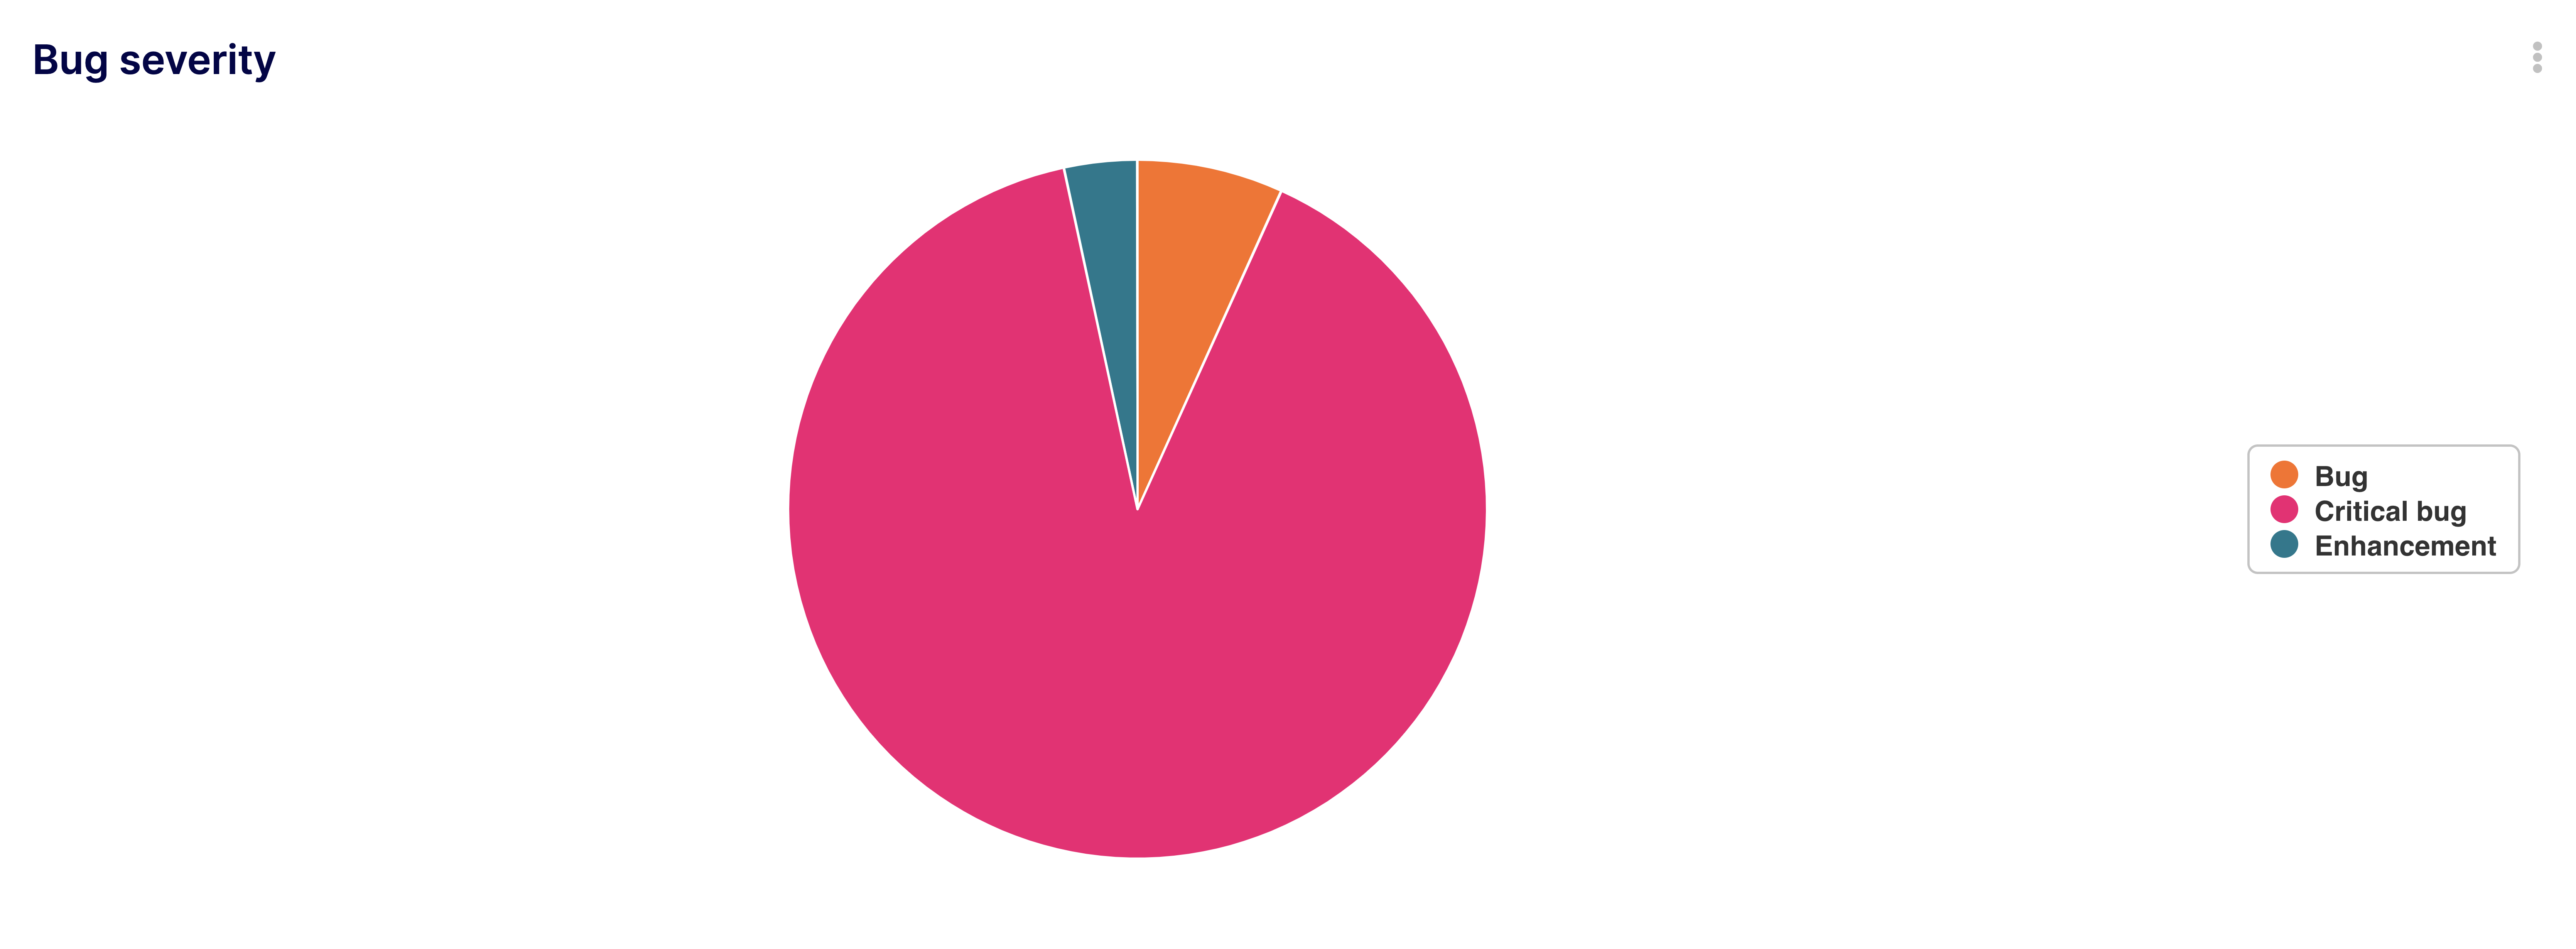
Visualize open bugs categorized by severity to prioritize fixes and improve software quality.
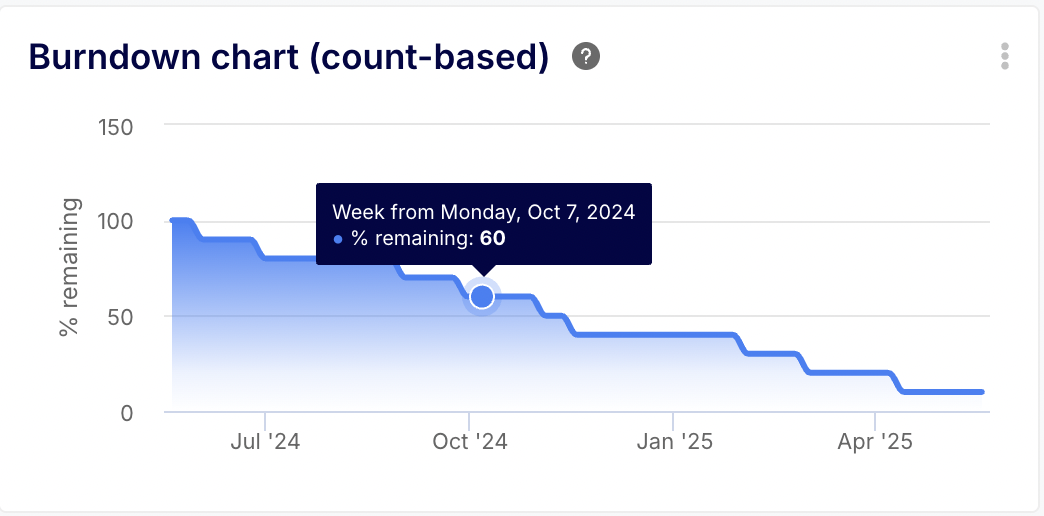
Track remaining work against time to forecast project completion and manage sprint progress.
Measure the percentage of deployments resulting in failures based on fix commits.
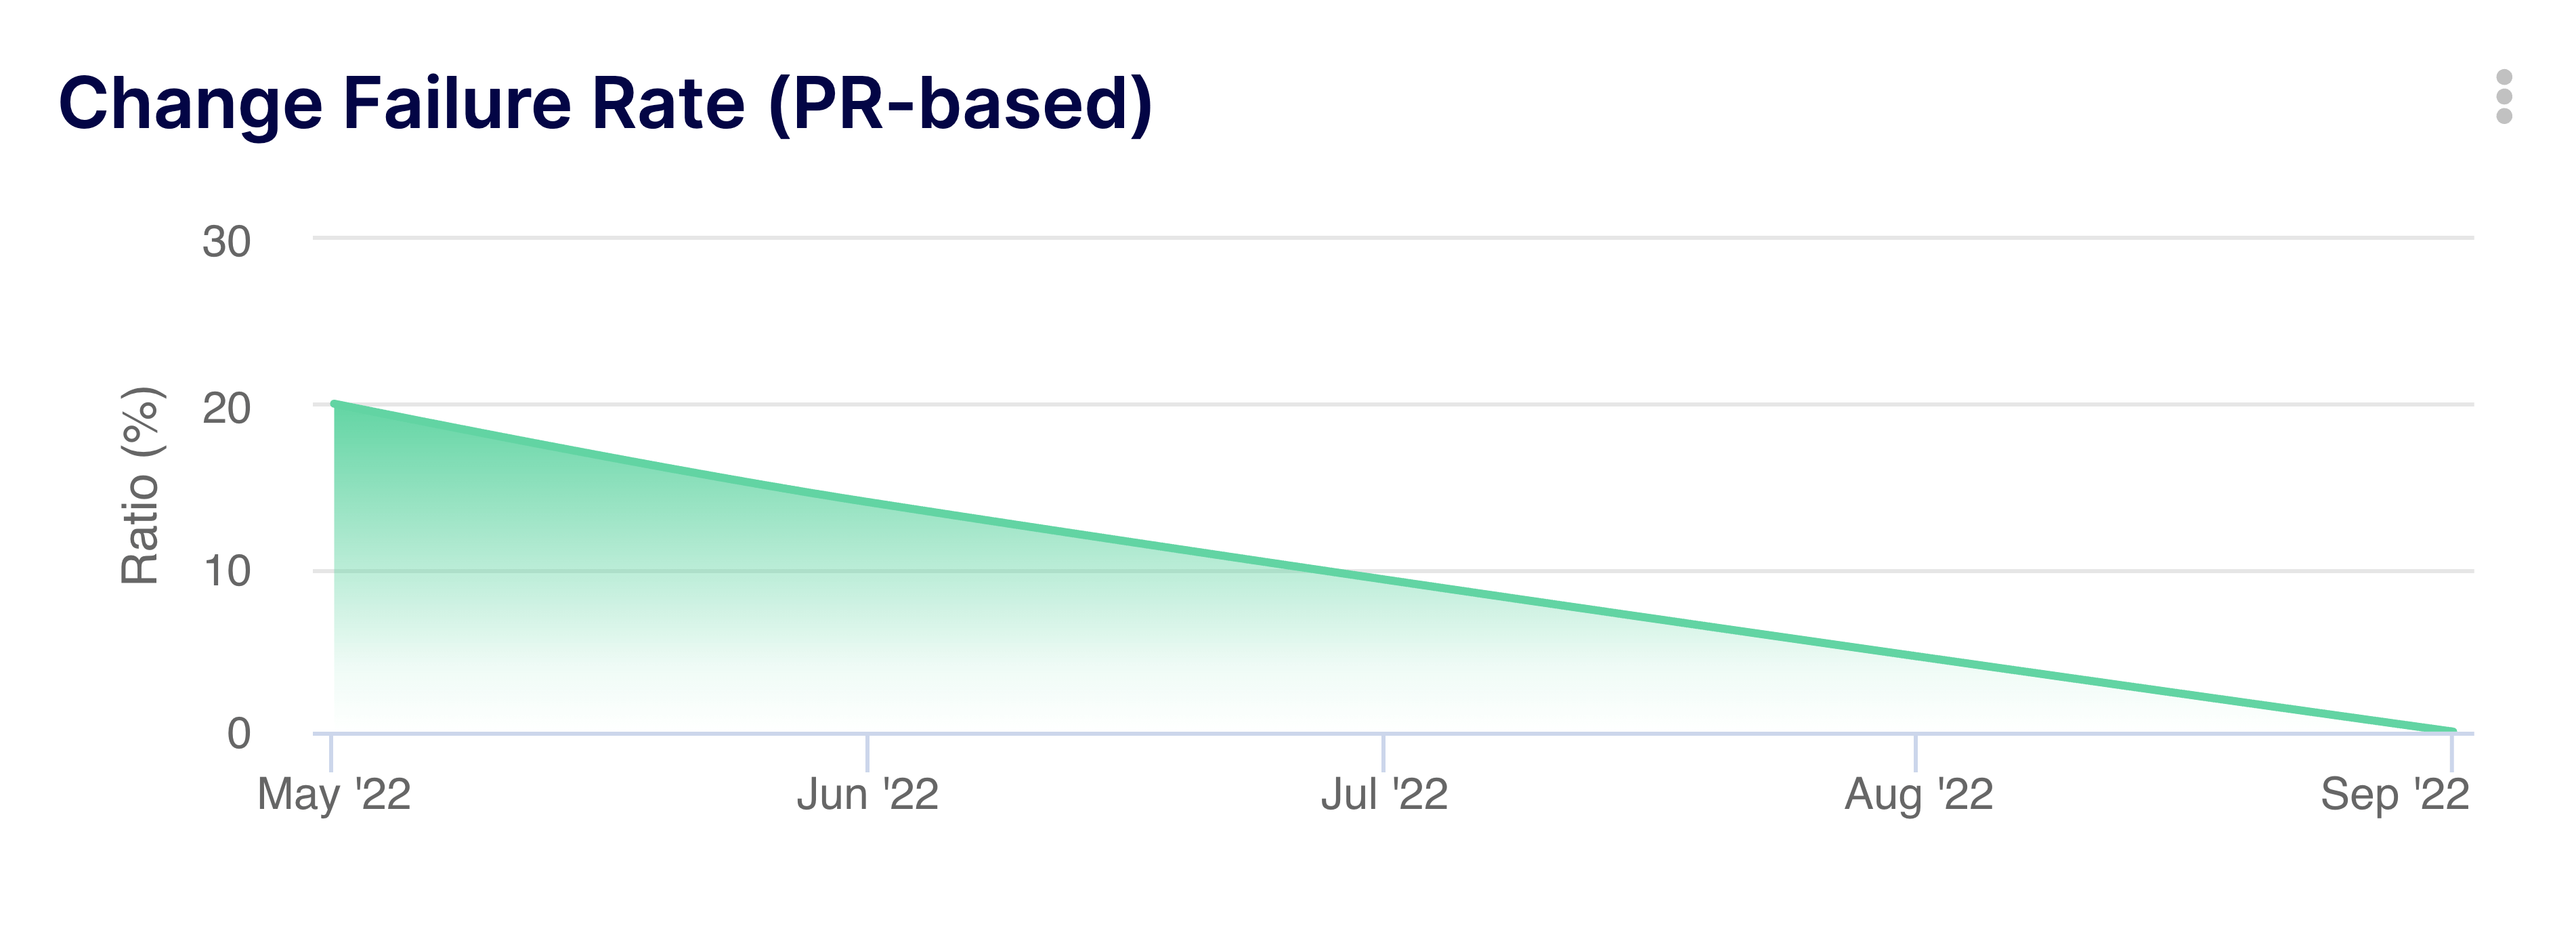
Calculate the failure rate of changes by tracking pull requests labeled as bugs after merging.
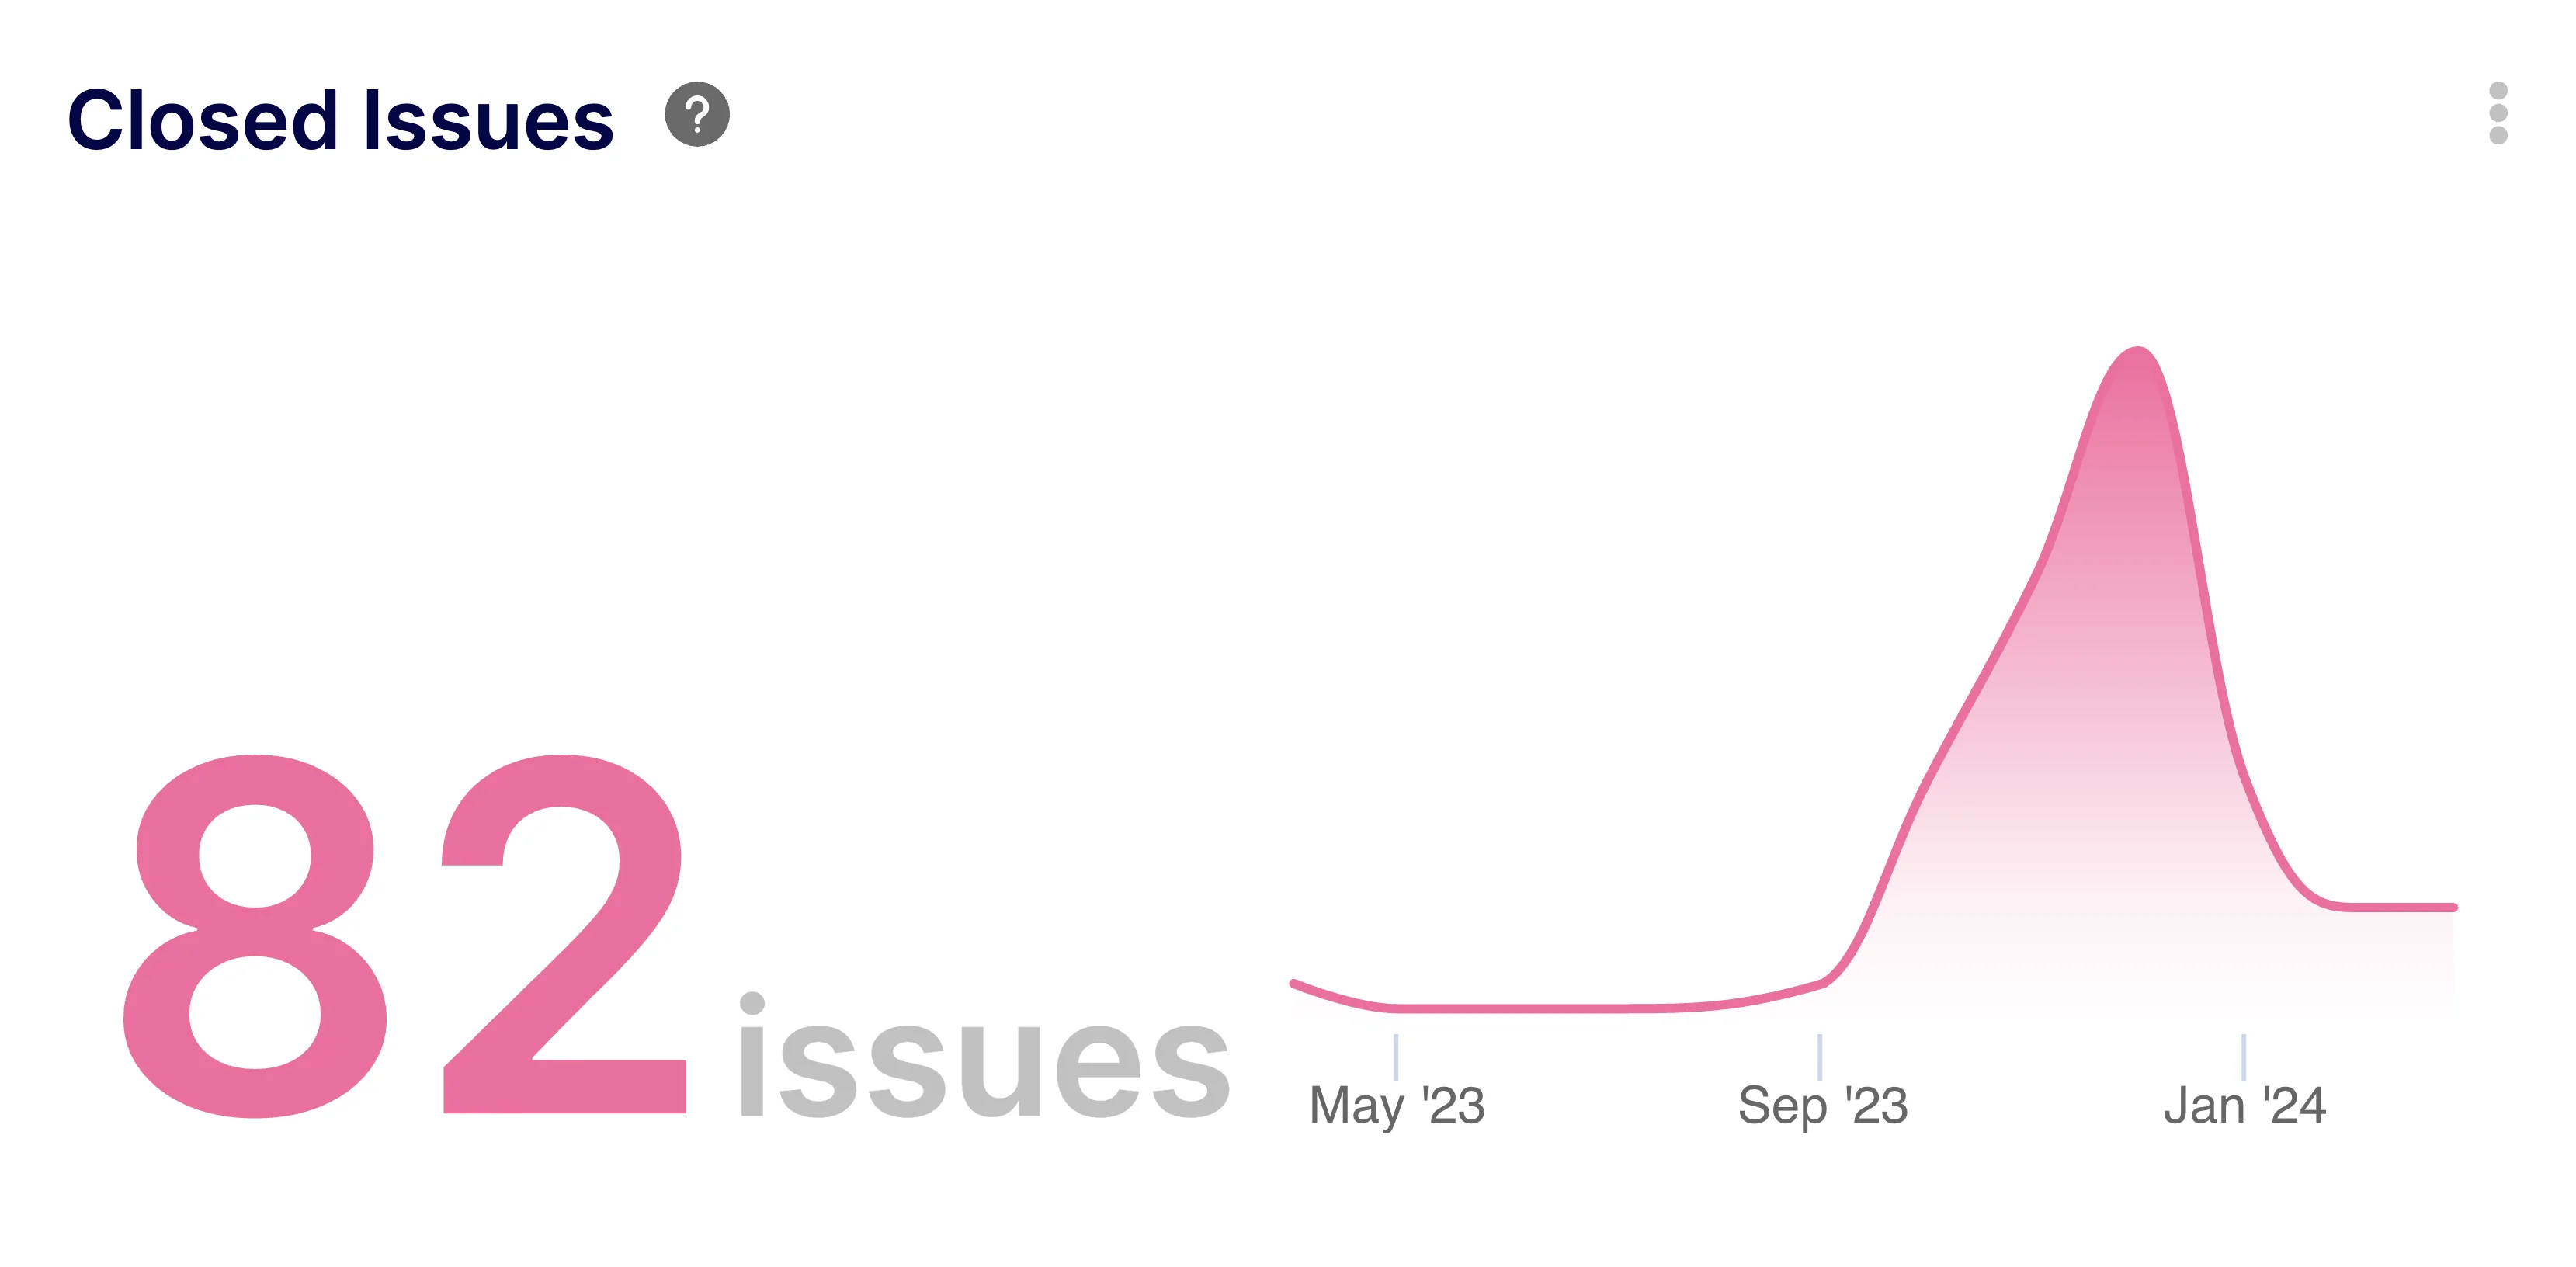
Analyze closed issues to understand completion rates and team velocity over time.
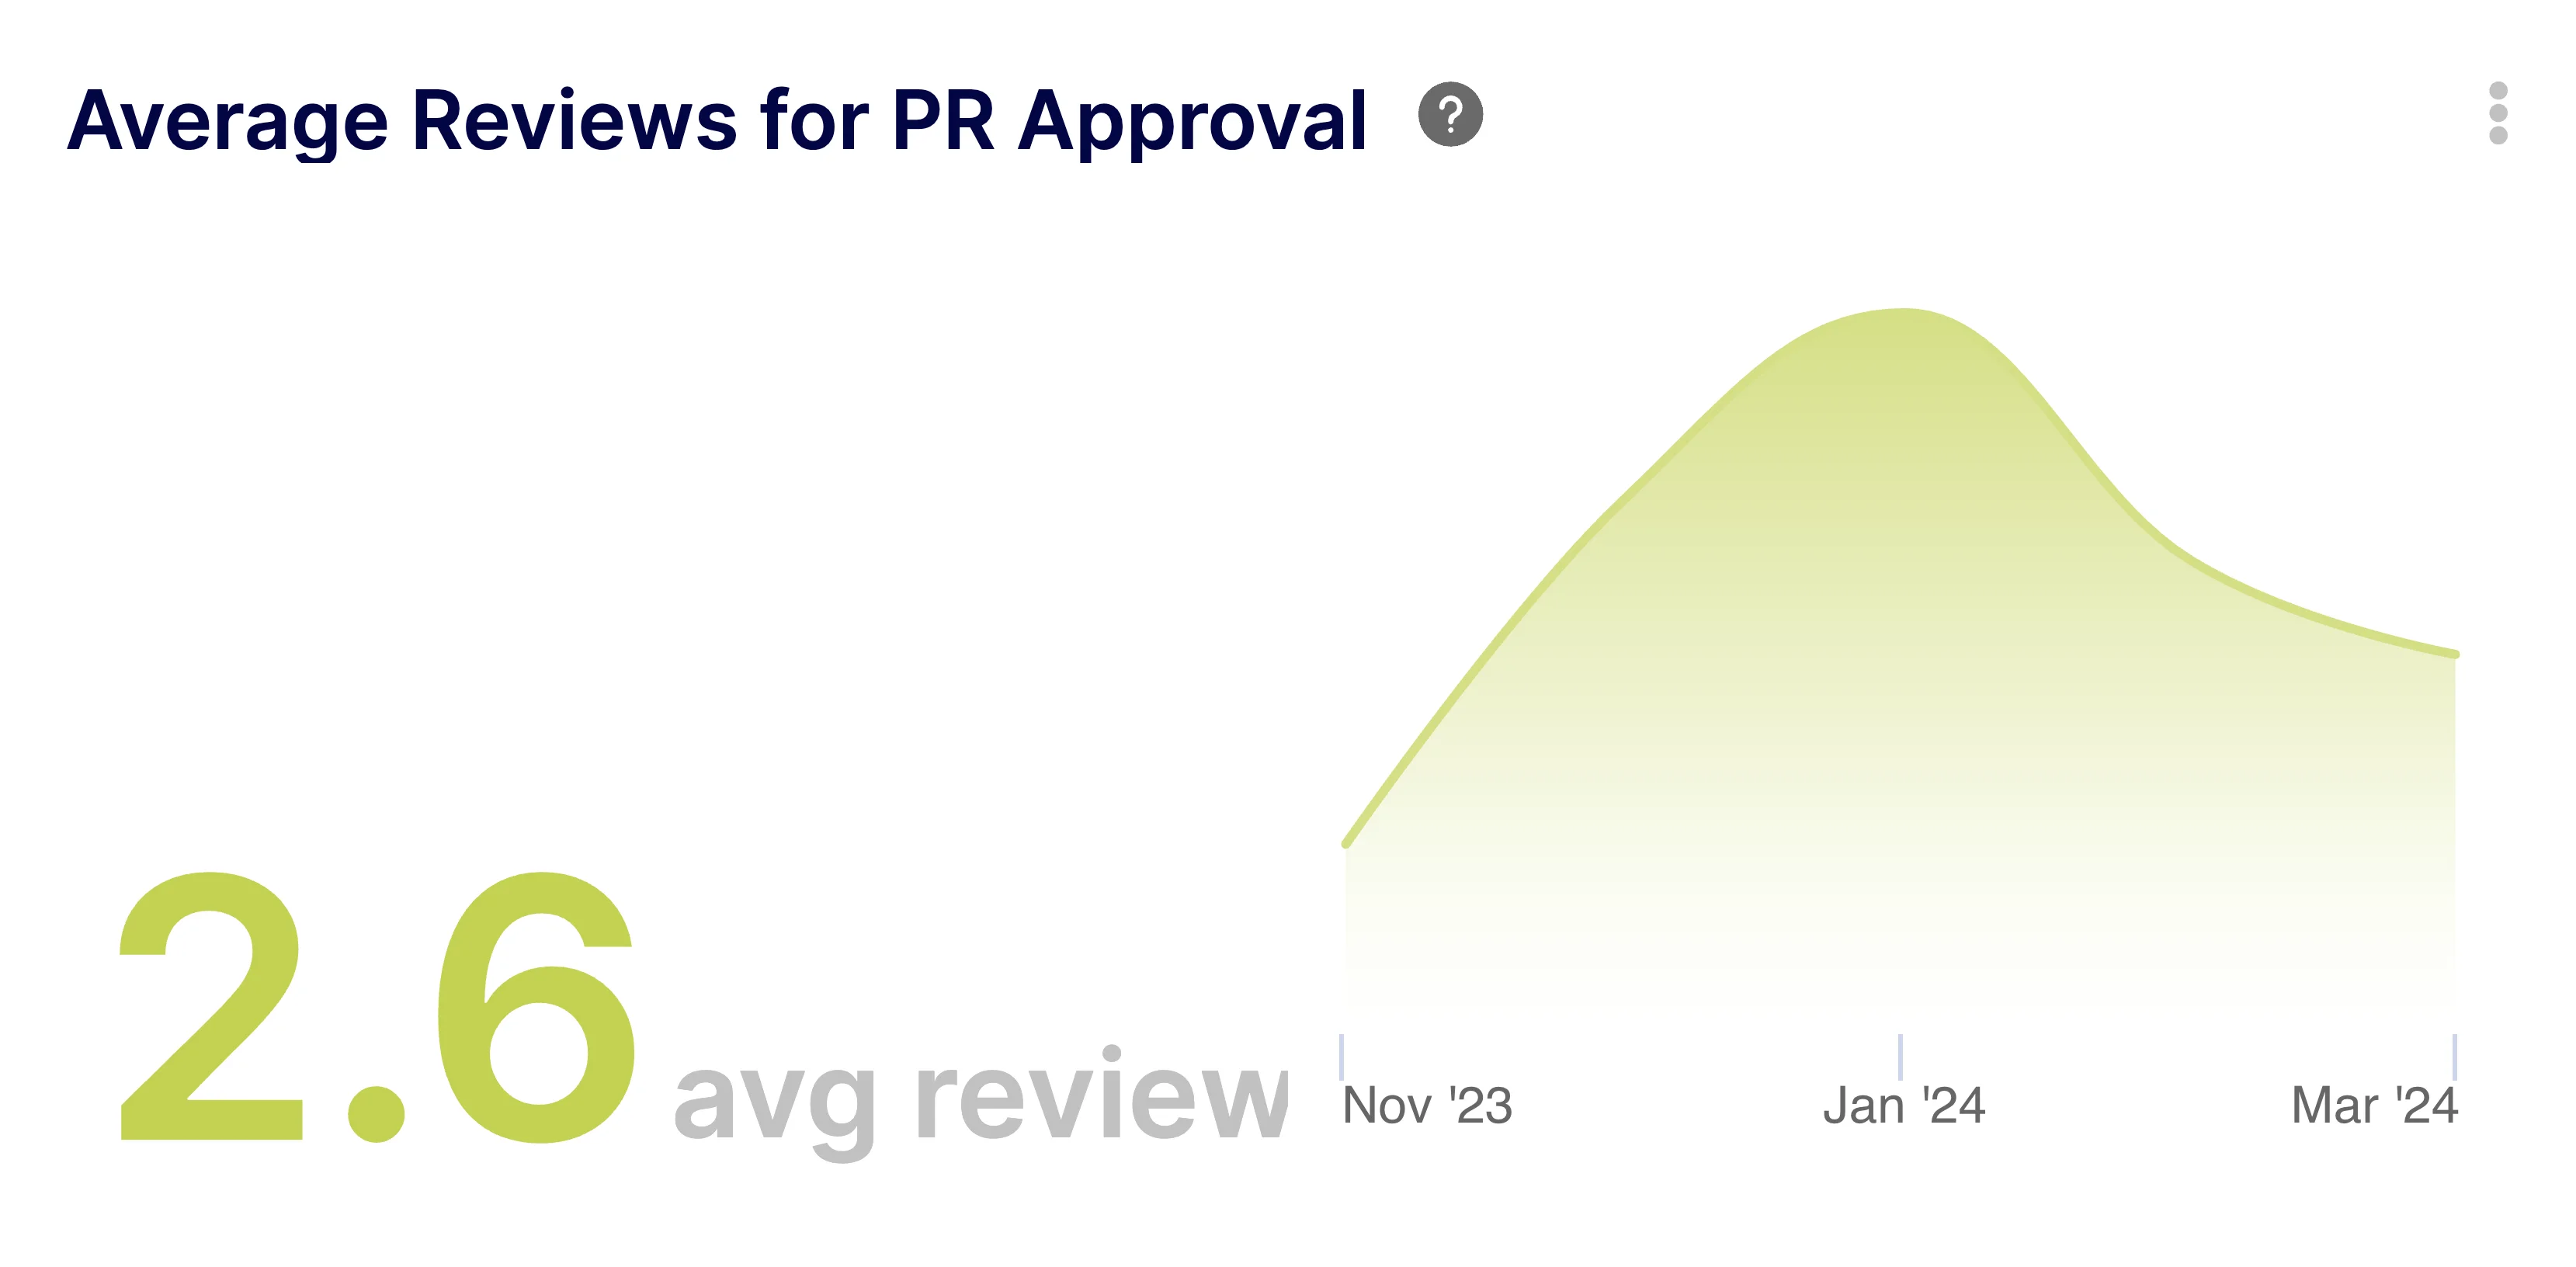
Get a comprehensive breakdown of review times and feedback cycles to optimize your code review process.
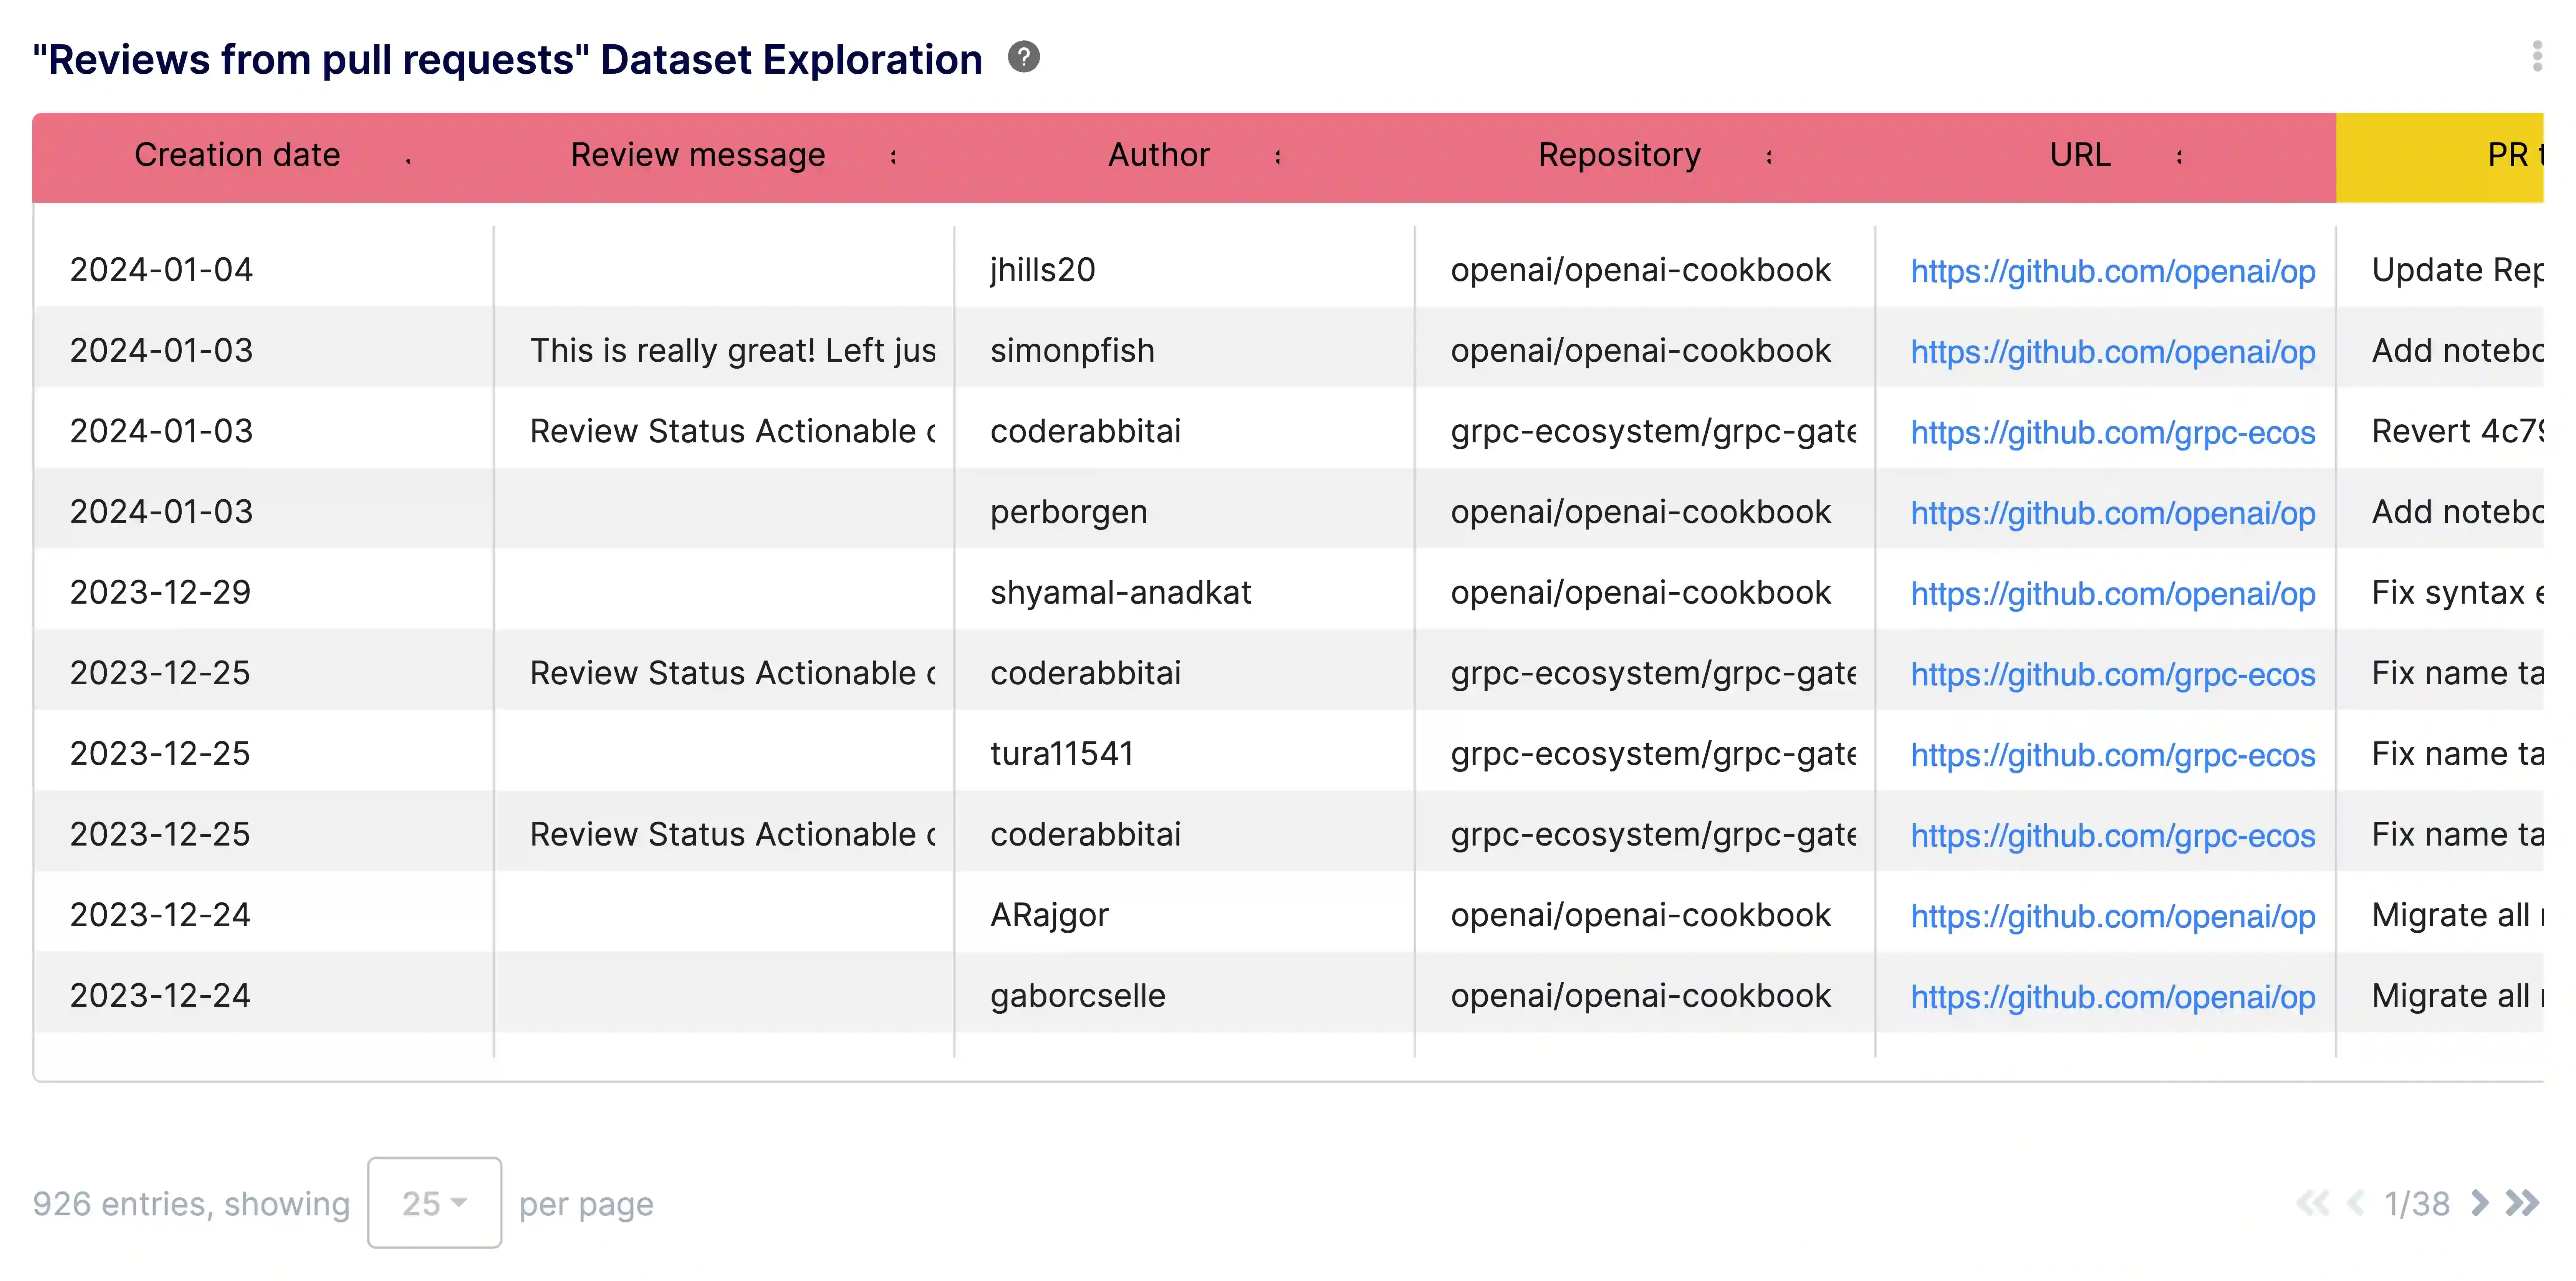
Access raw data on code reviews to perform custom analysis on feedback loops and reviewer participation.
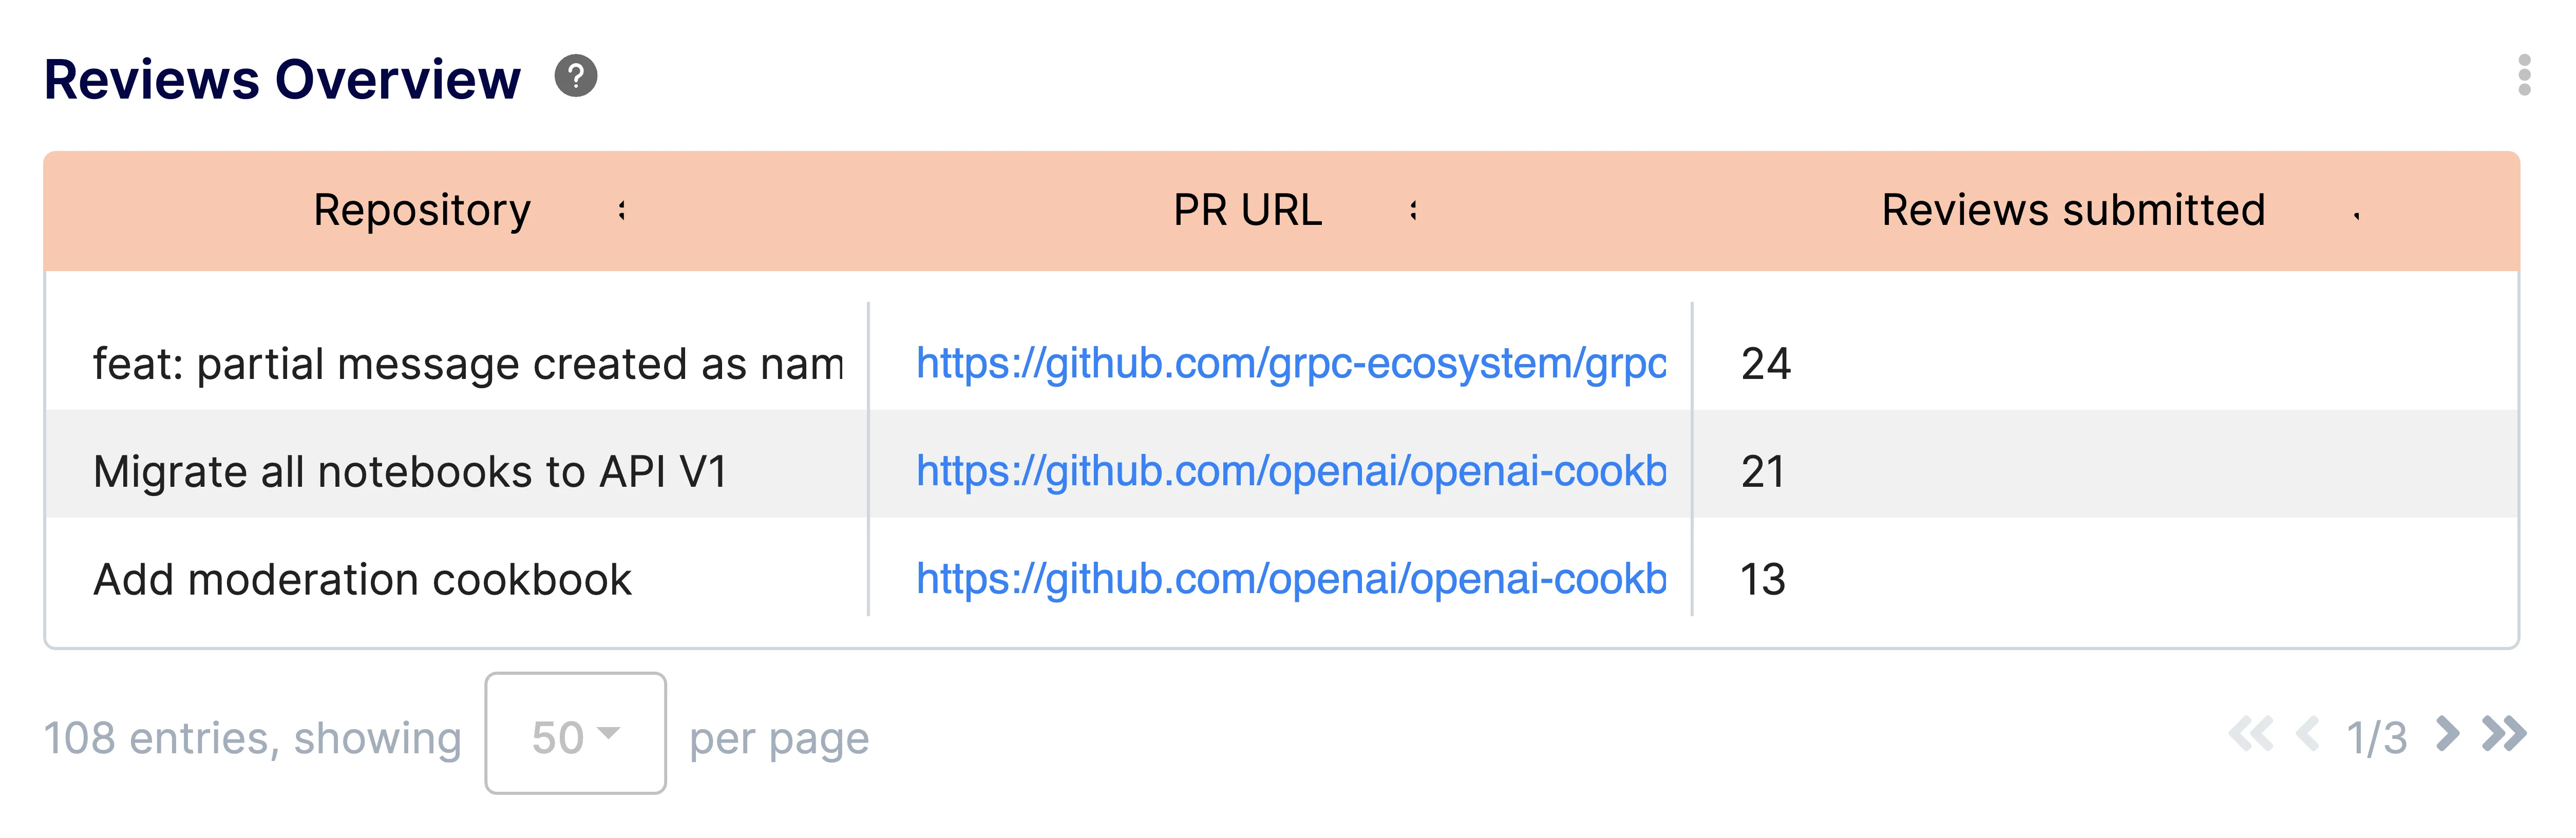
Gain a high-level view of code review activity, including review volume and turnaround times.
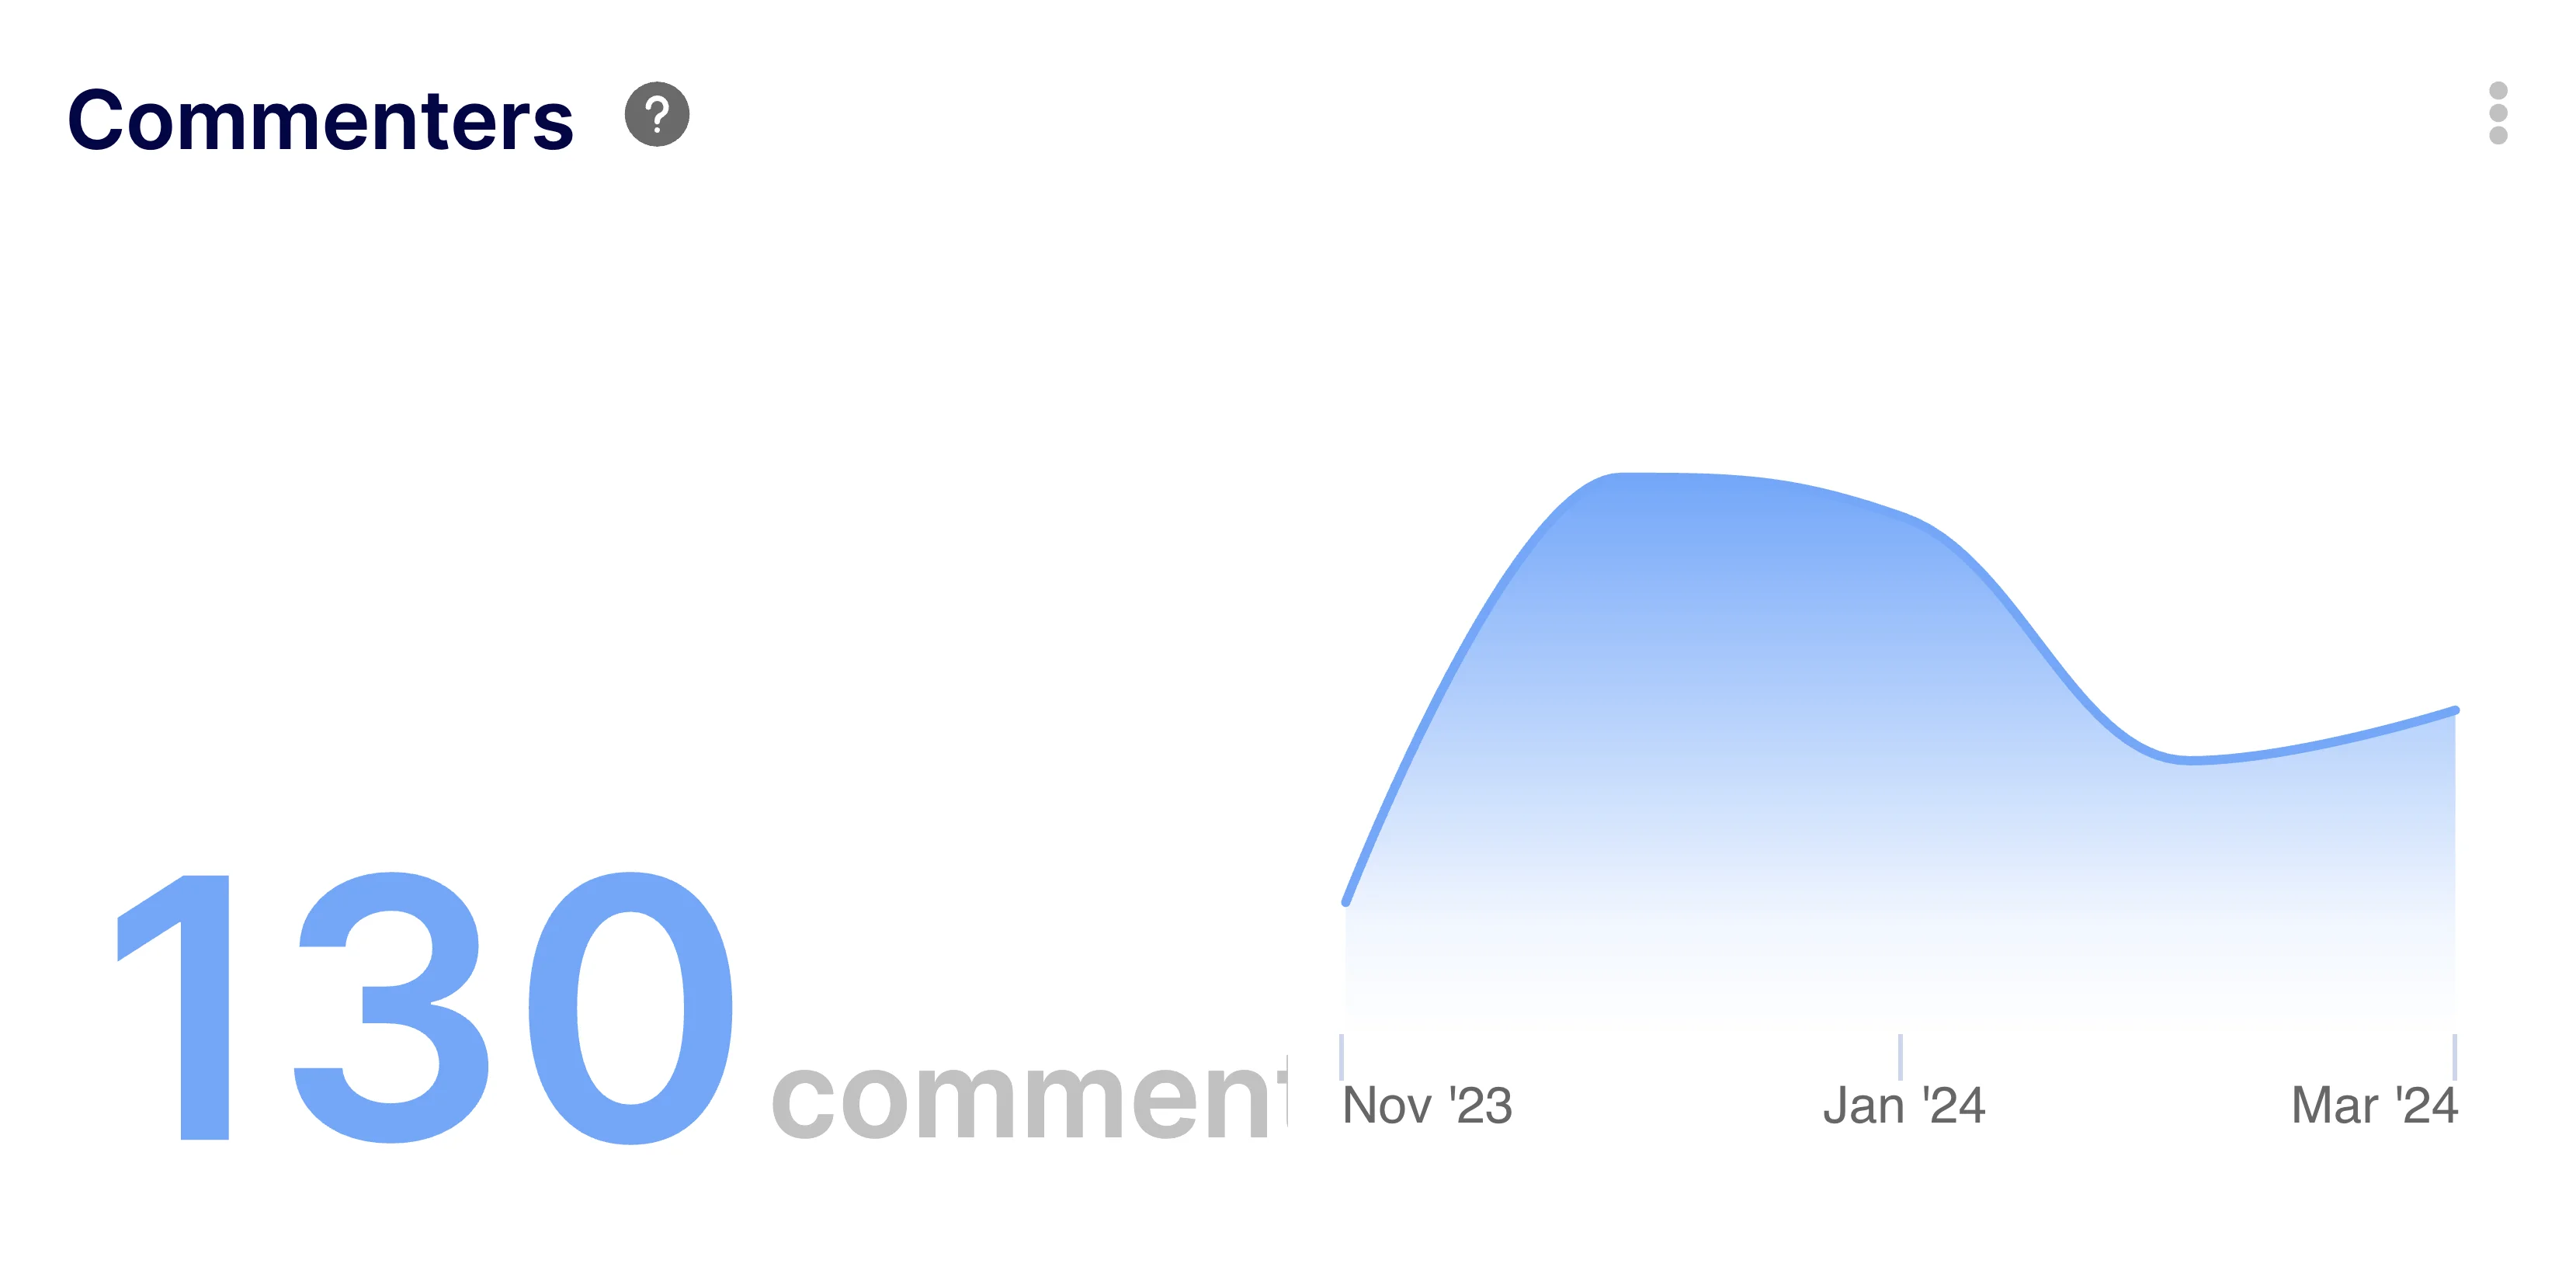
Identify who is contributing to discussions in your pull requests to ensure inclusive team collaboration.
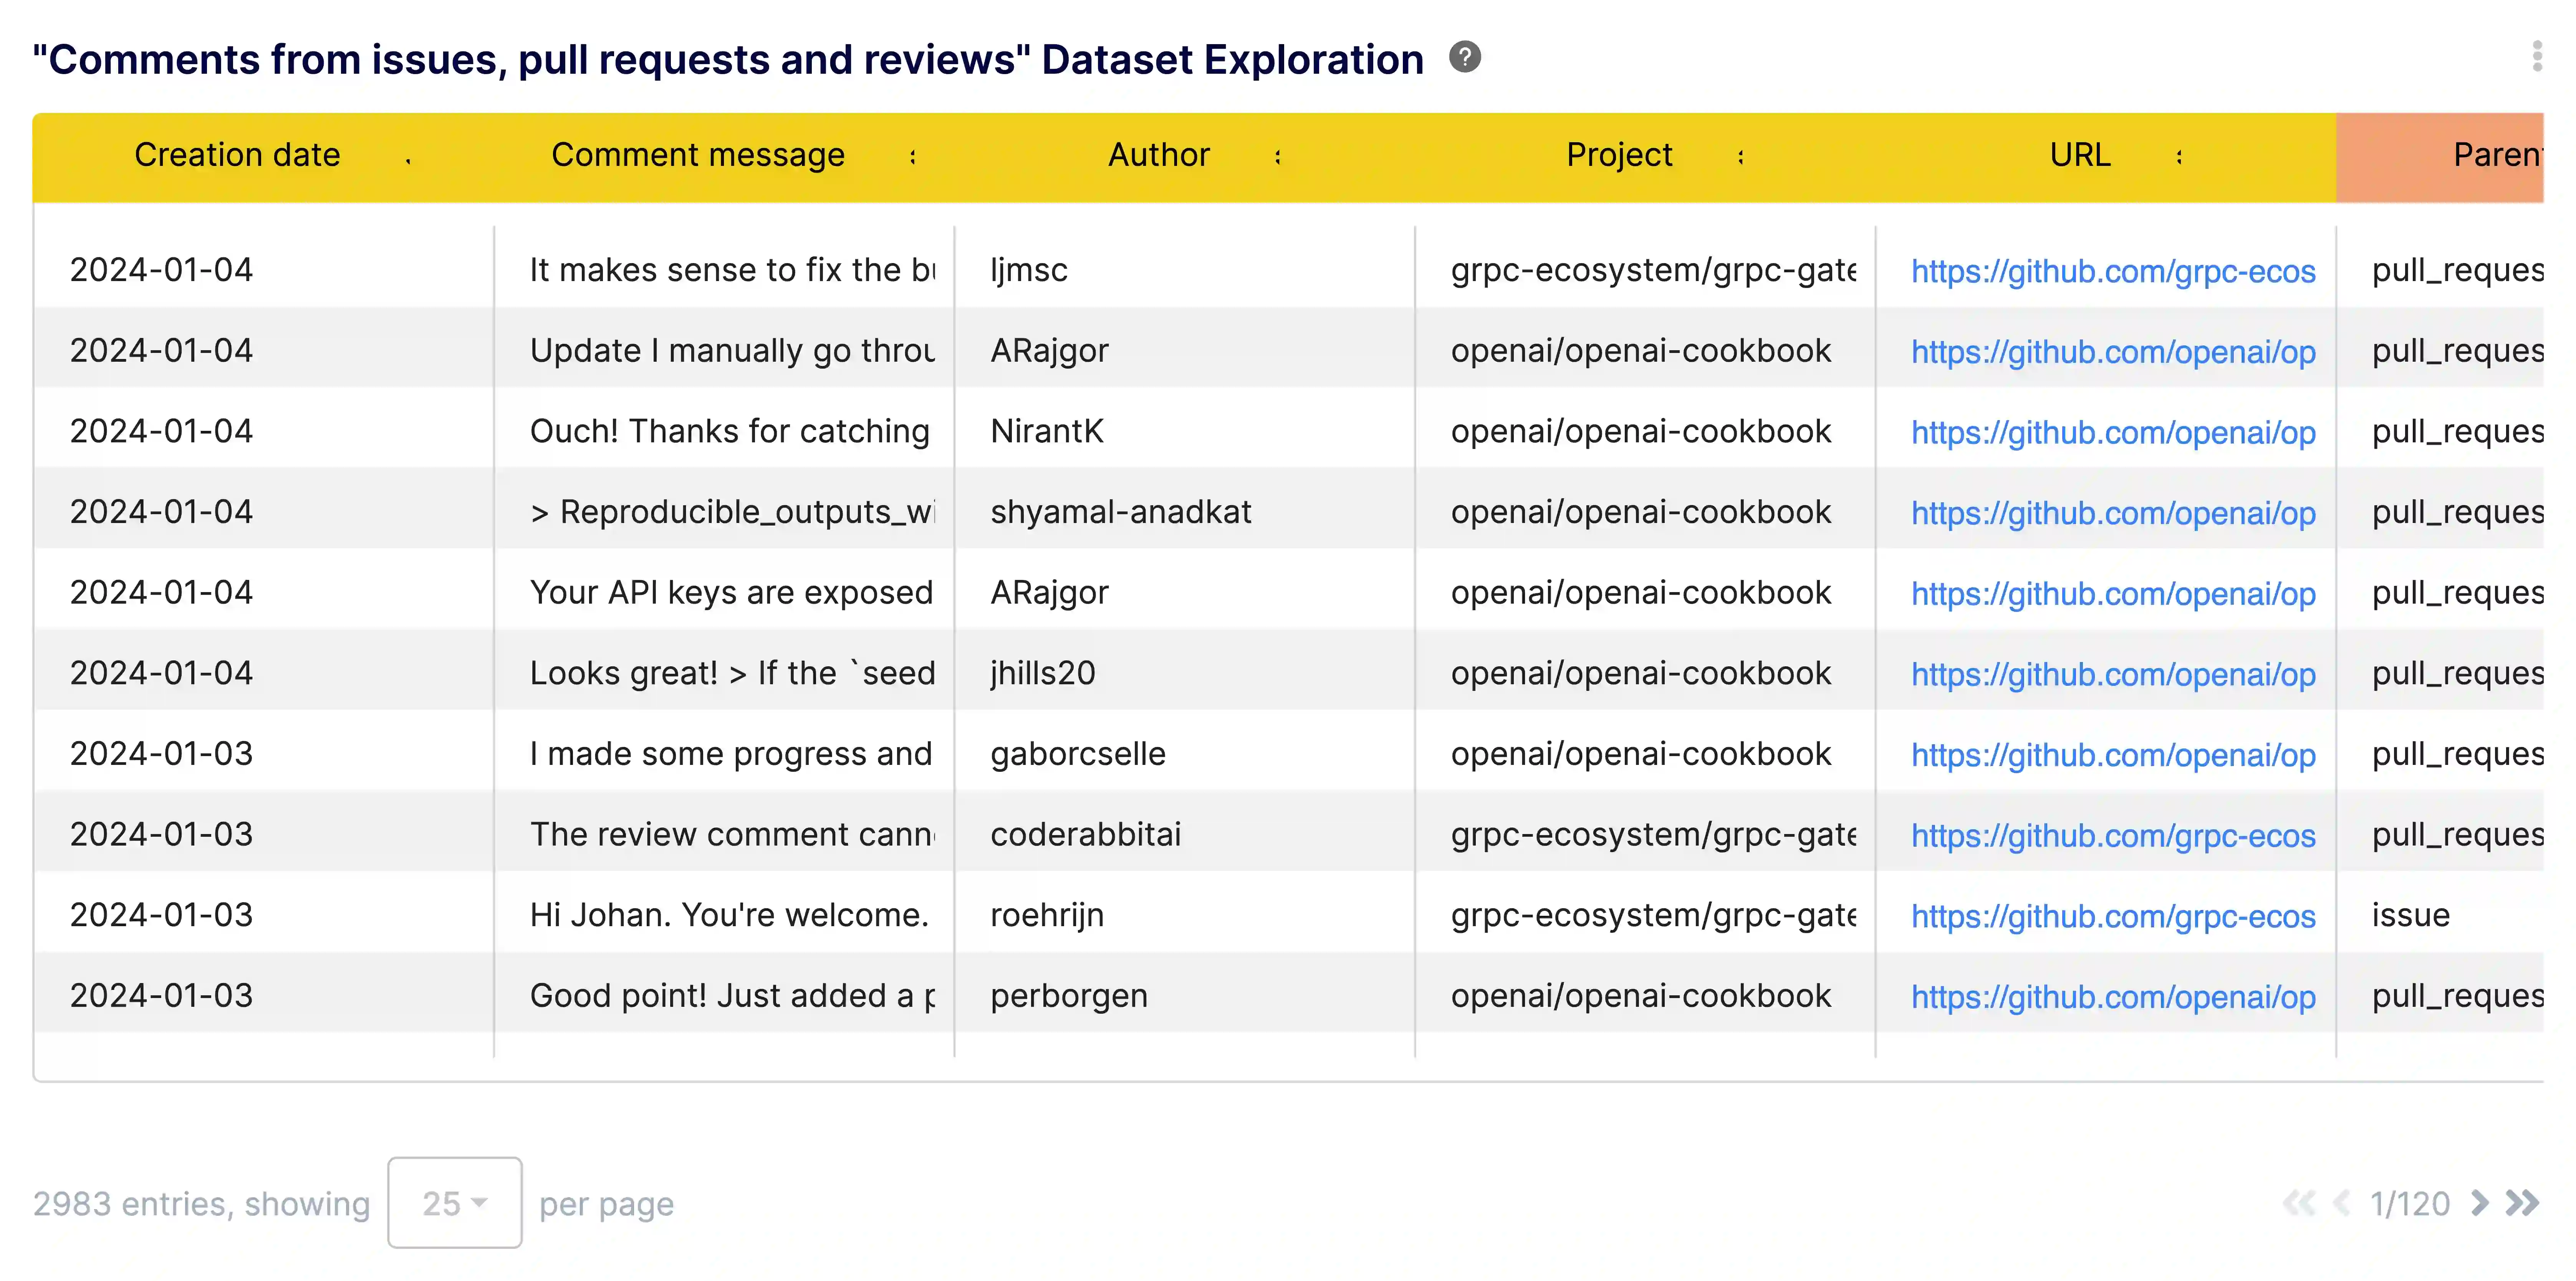
Dive into detailed comment data to analyze communication patterns and feedback quality in code reviews.
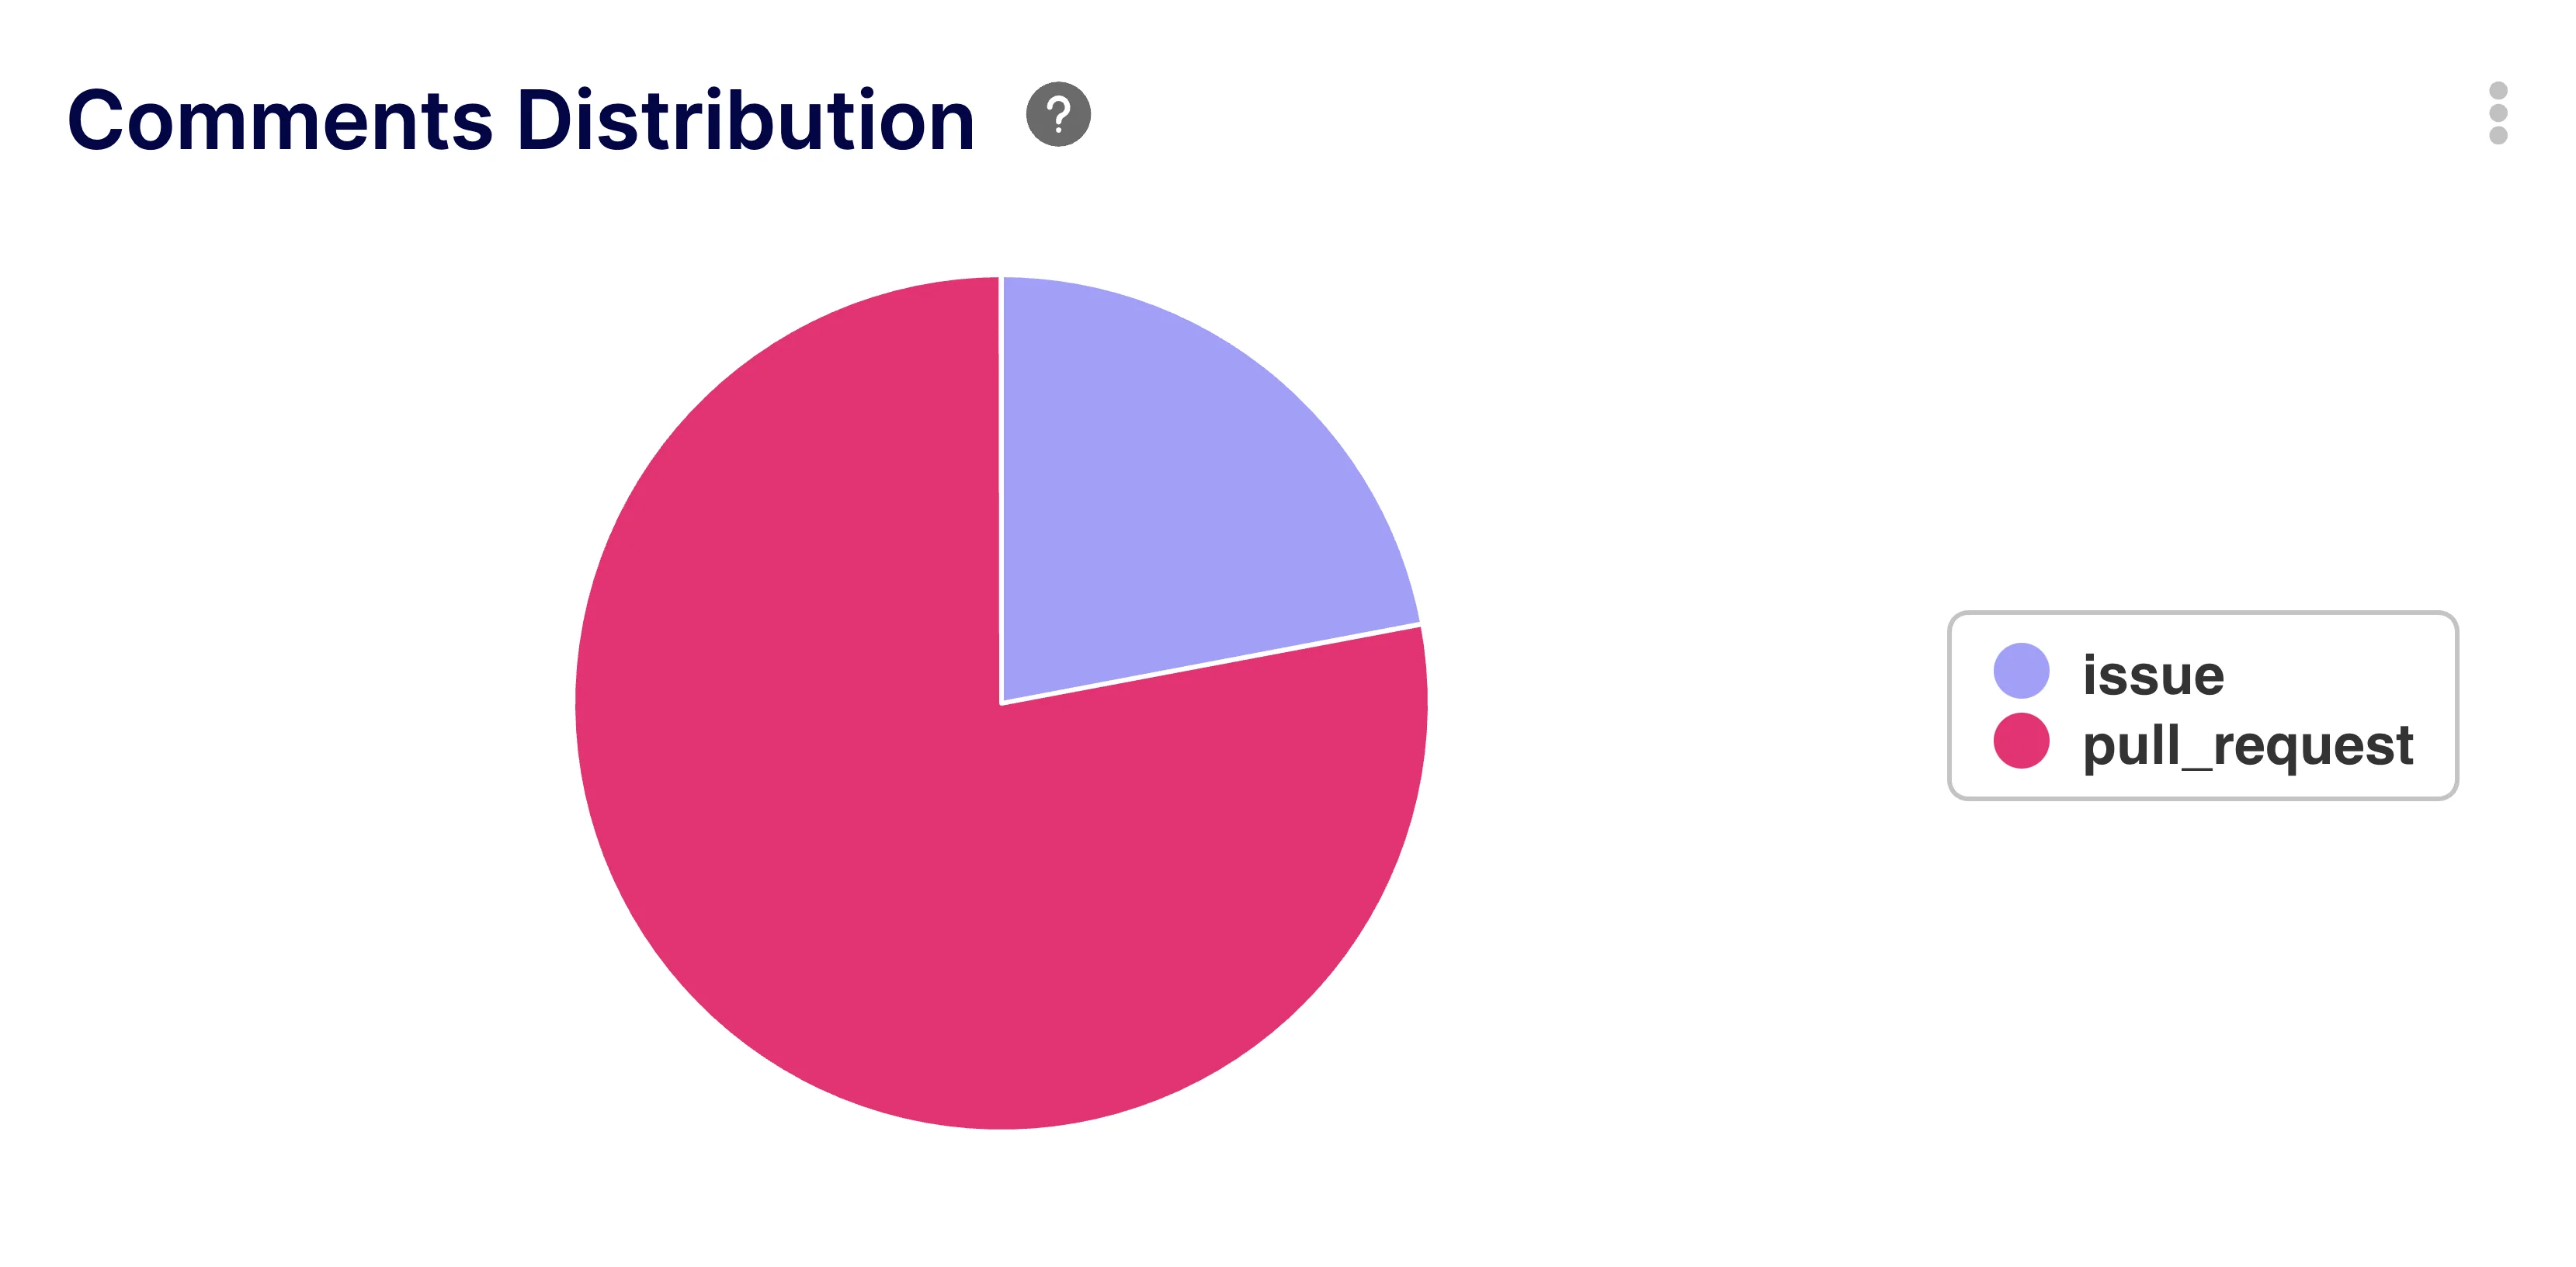
Visualize how comments are distributed across projects and PRs to understand collaboration hotspots.
Monitor the volume of commits over time to gauge development momentum and activity trends.
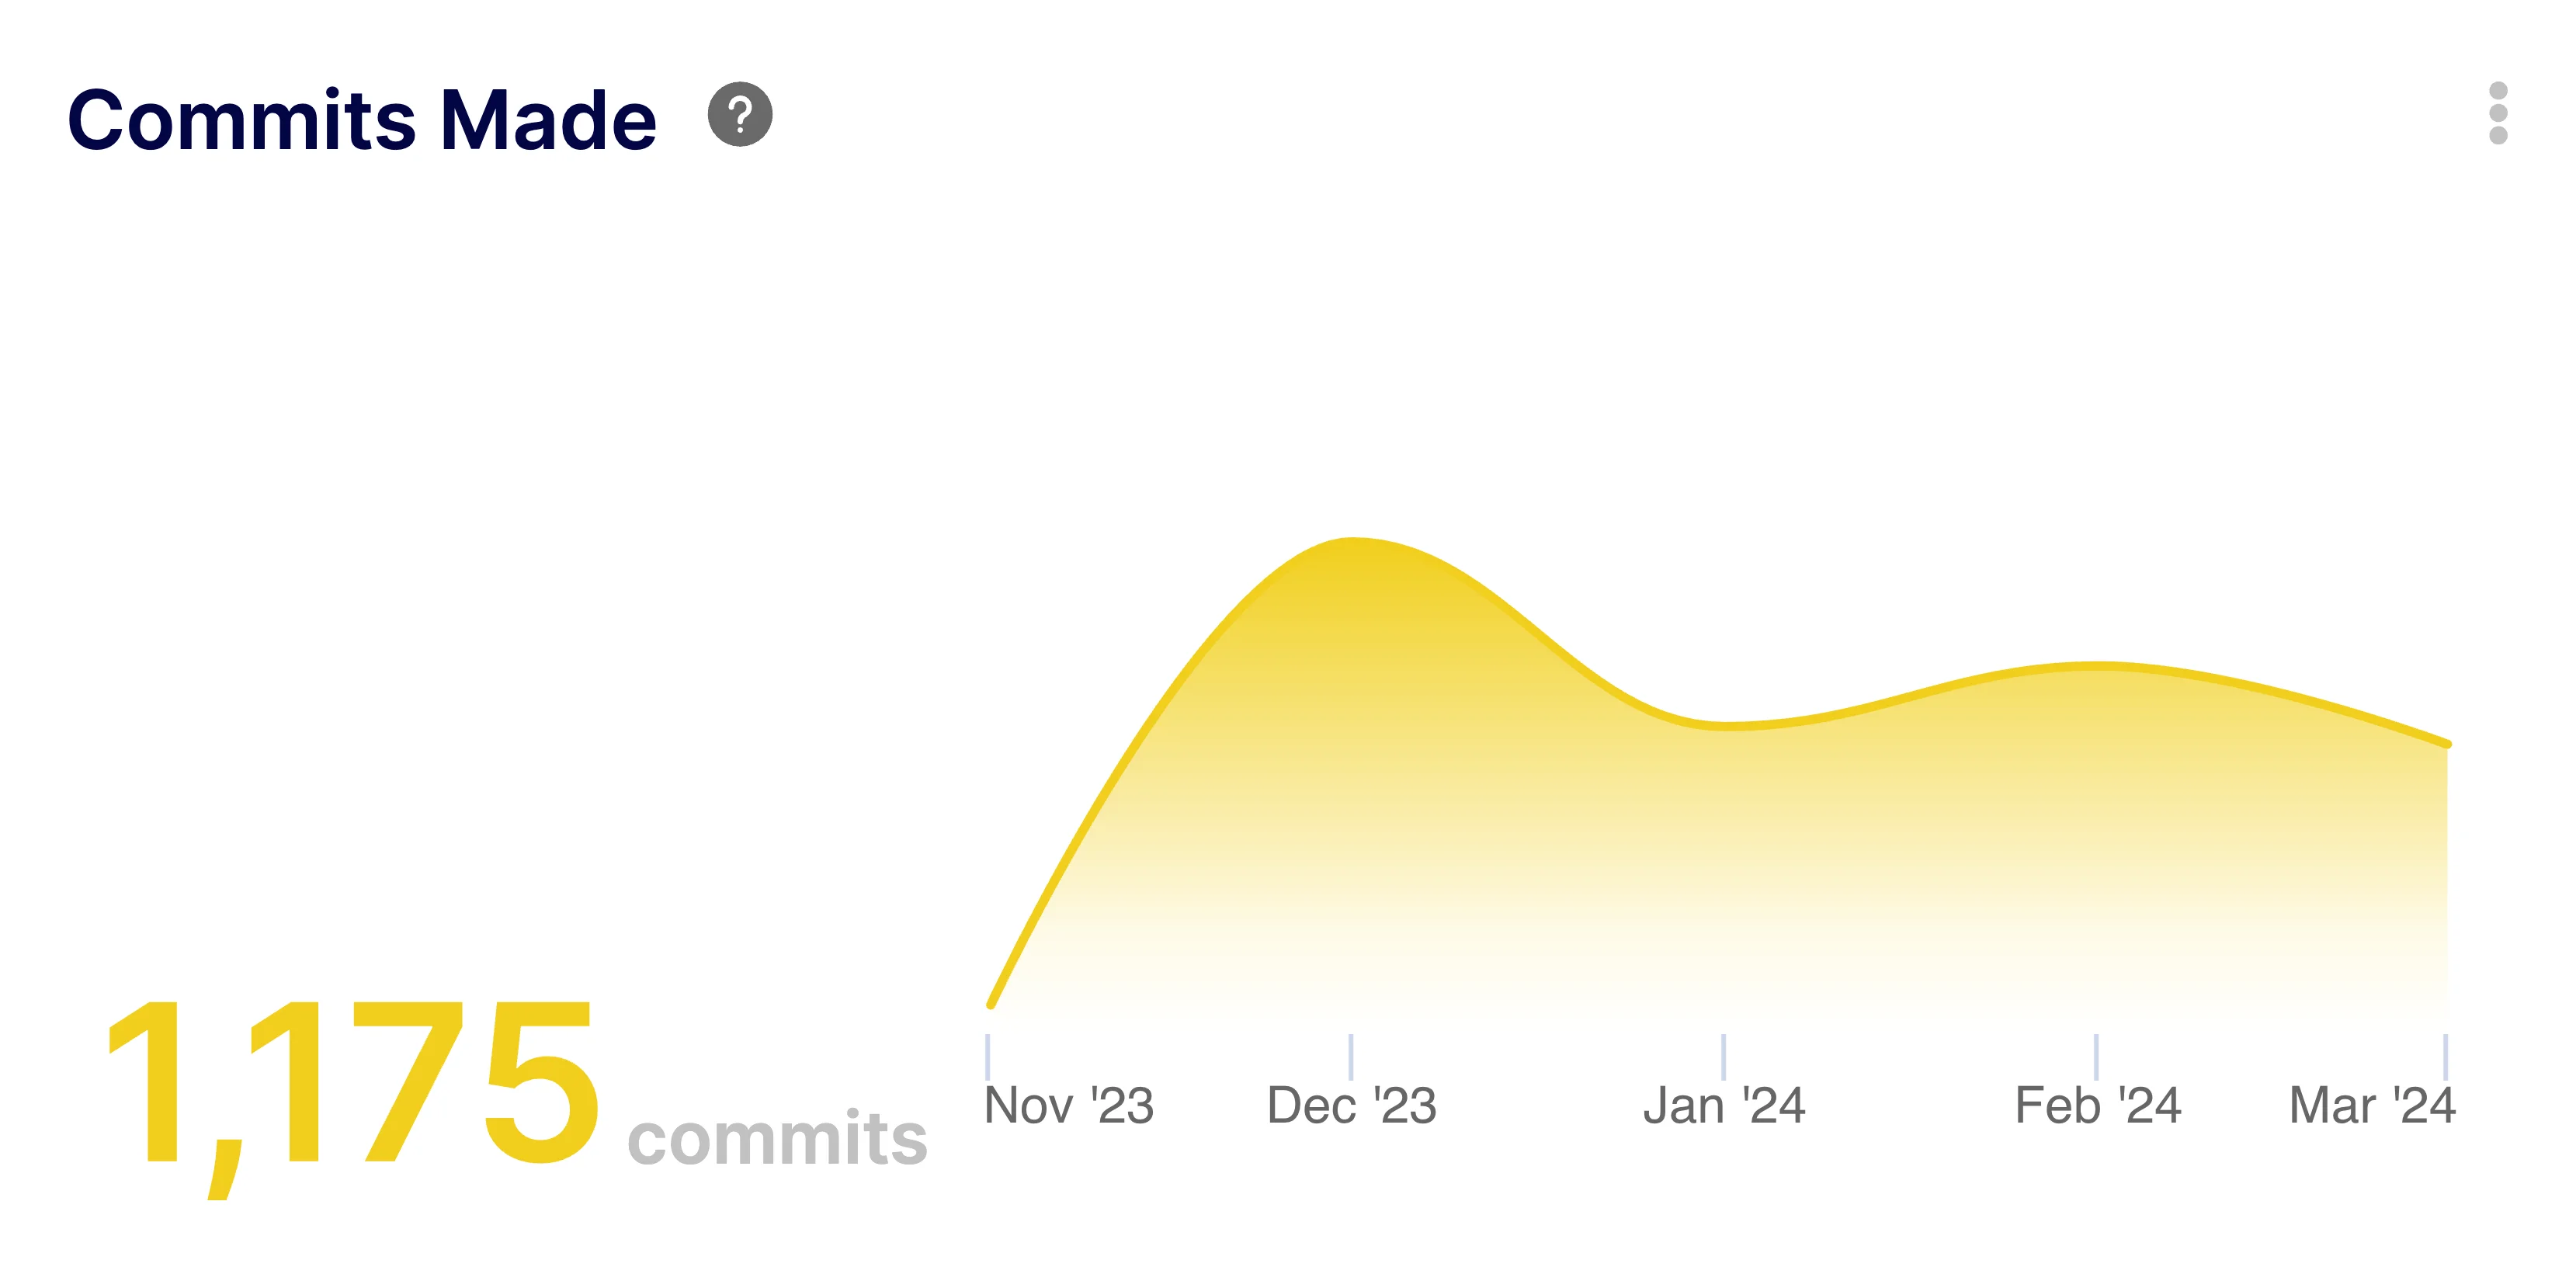
Track the total number of commits to measure coding activity and development throughput.
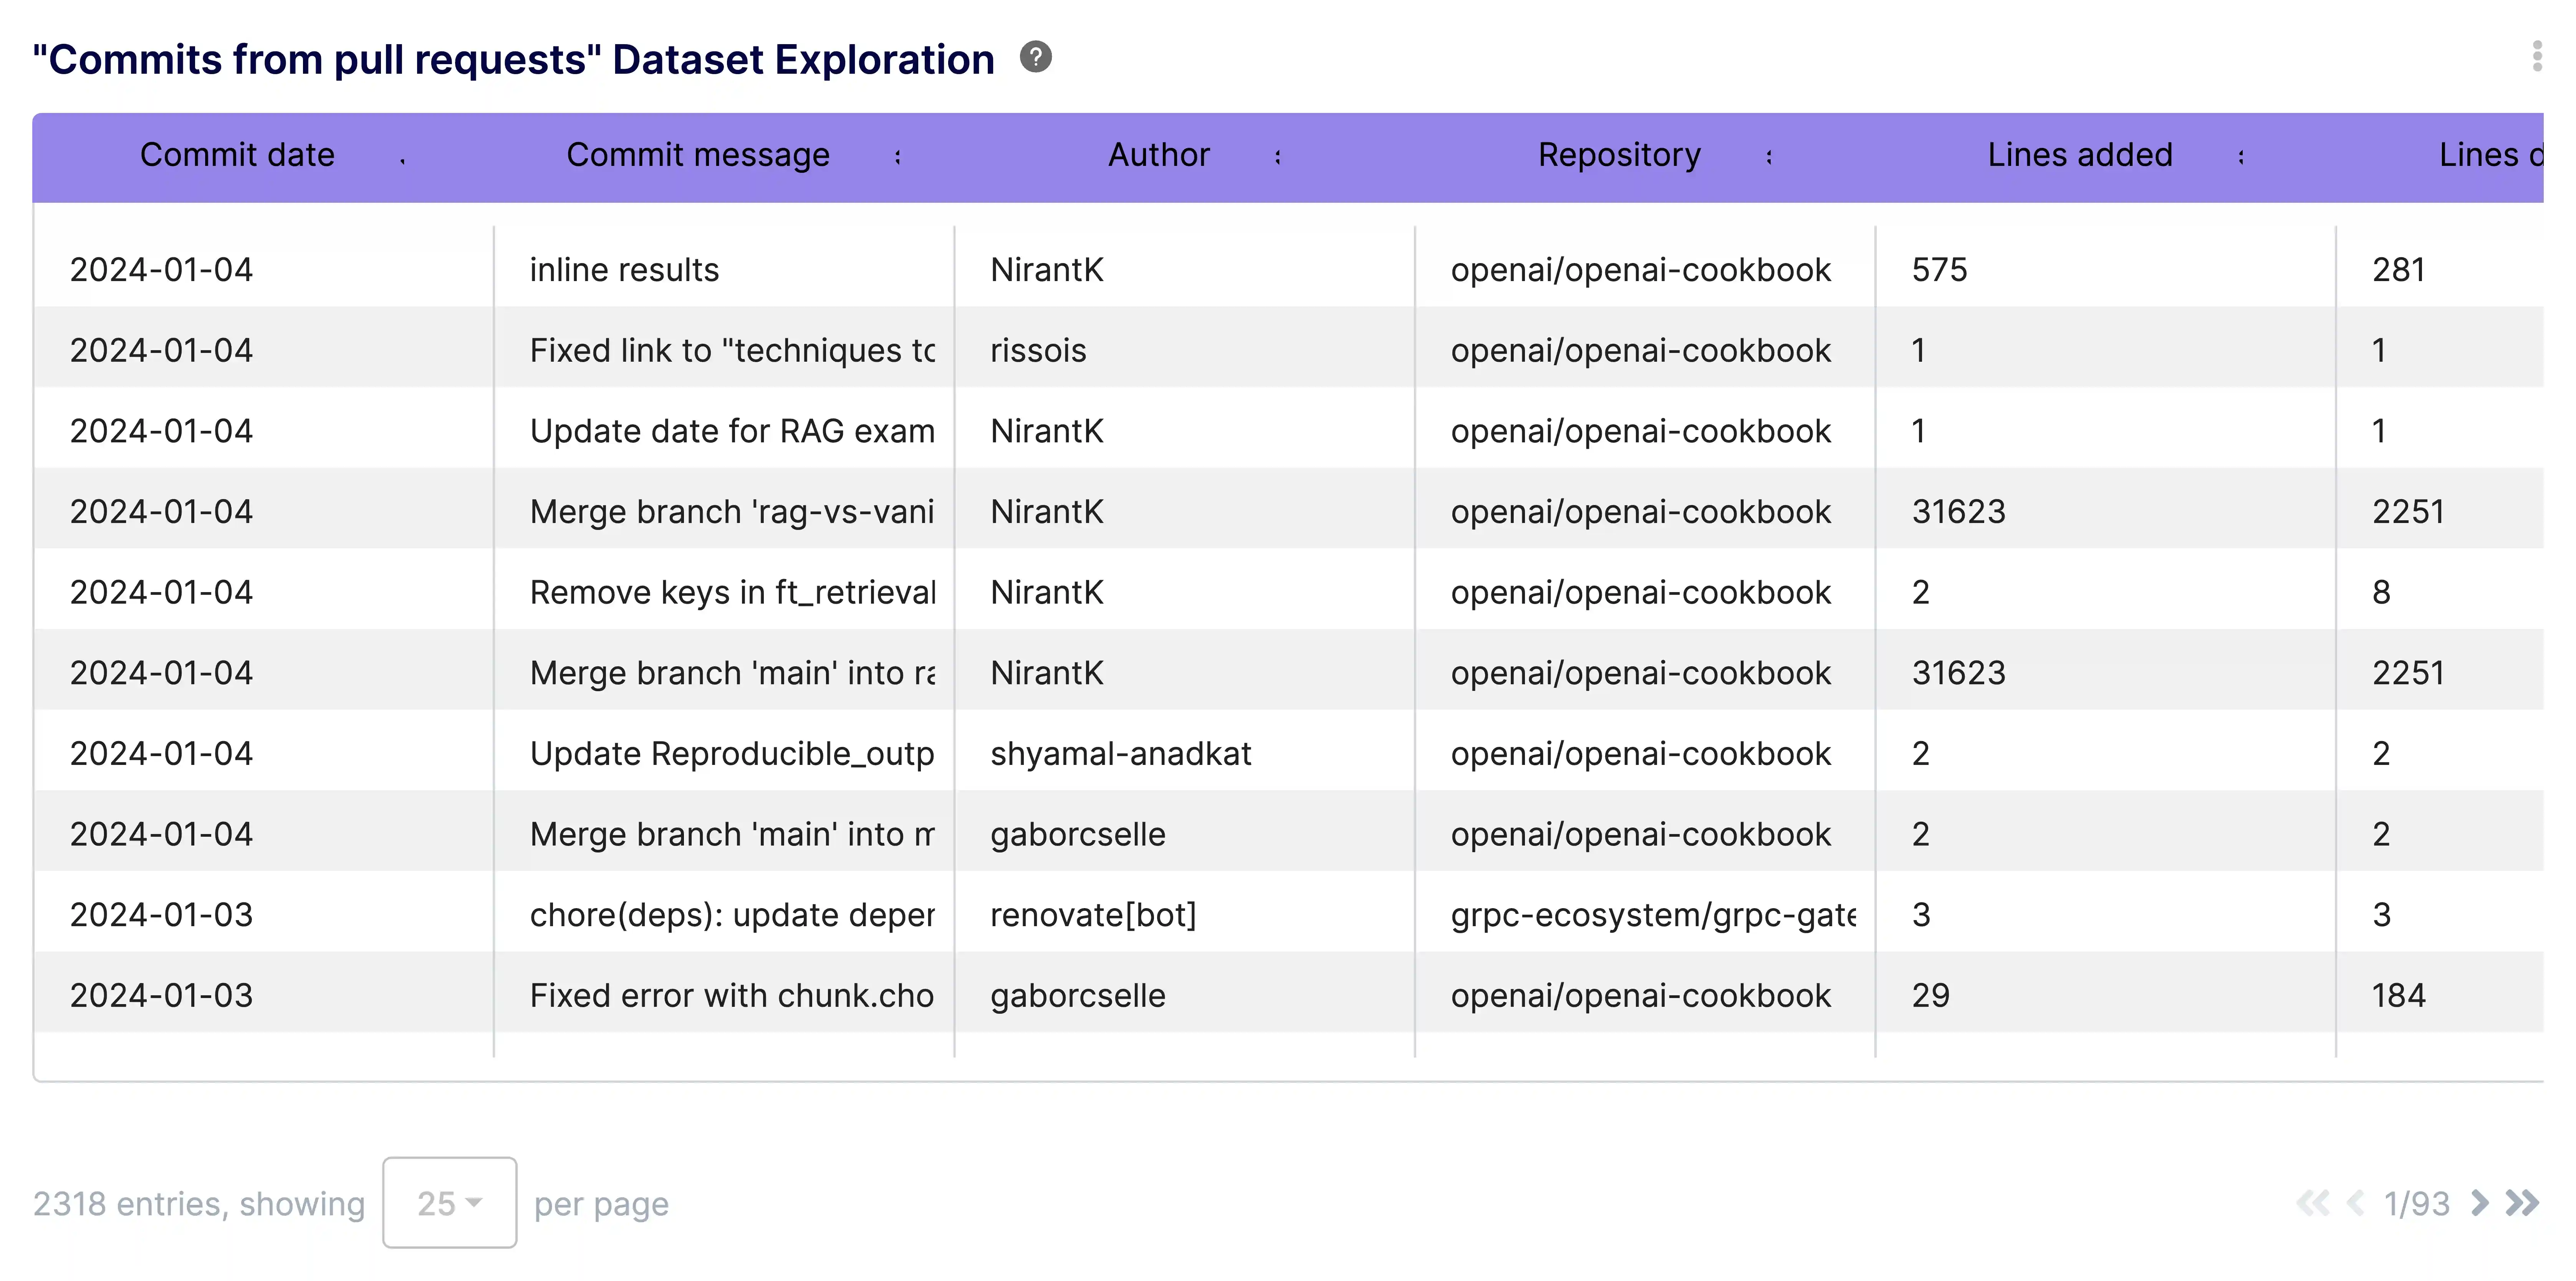
Access granular commit data to analyze coding patterns, churn, and individual contributions.
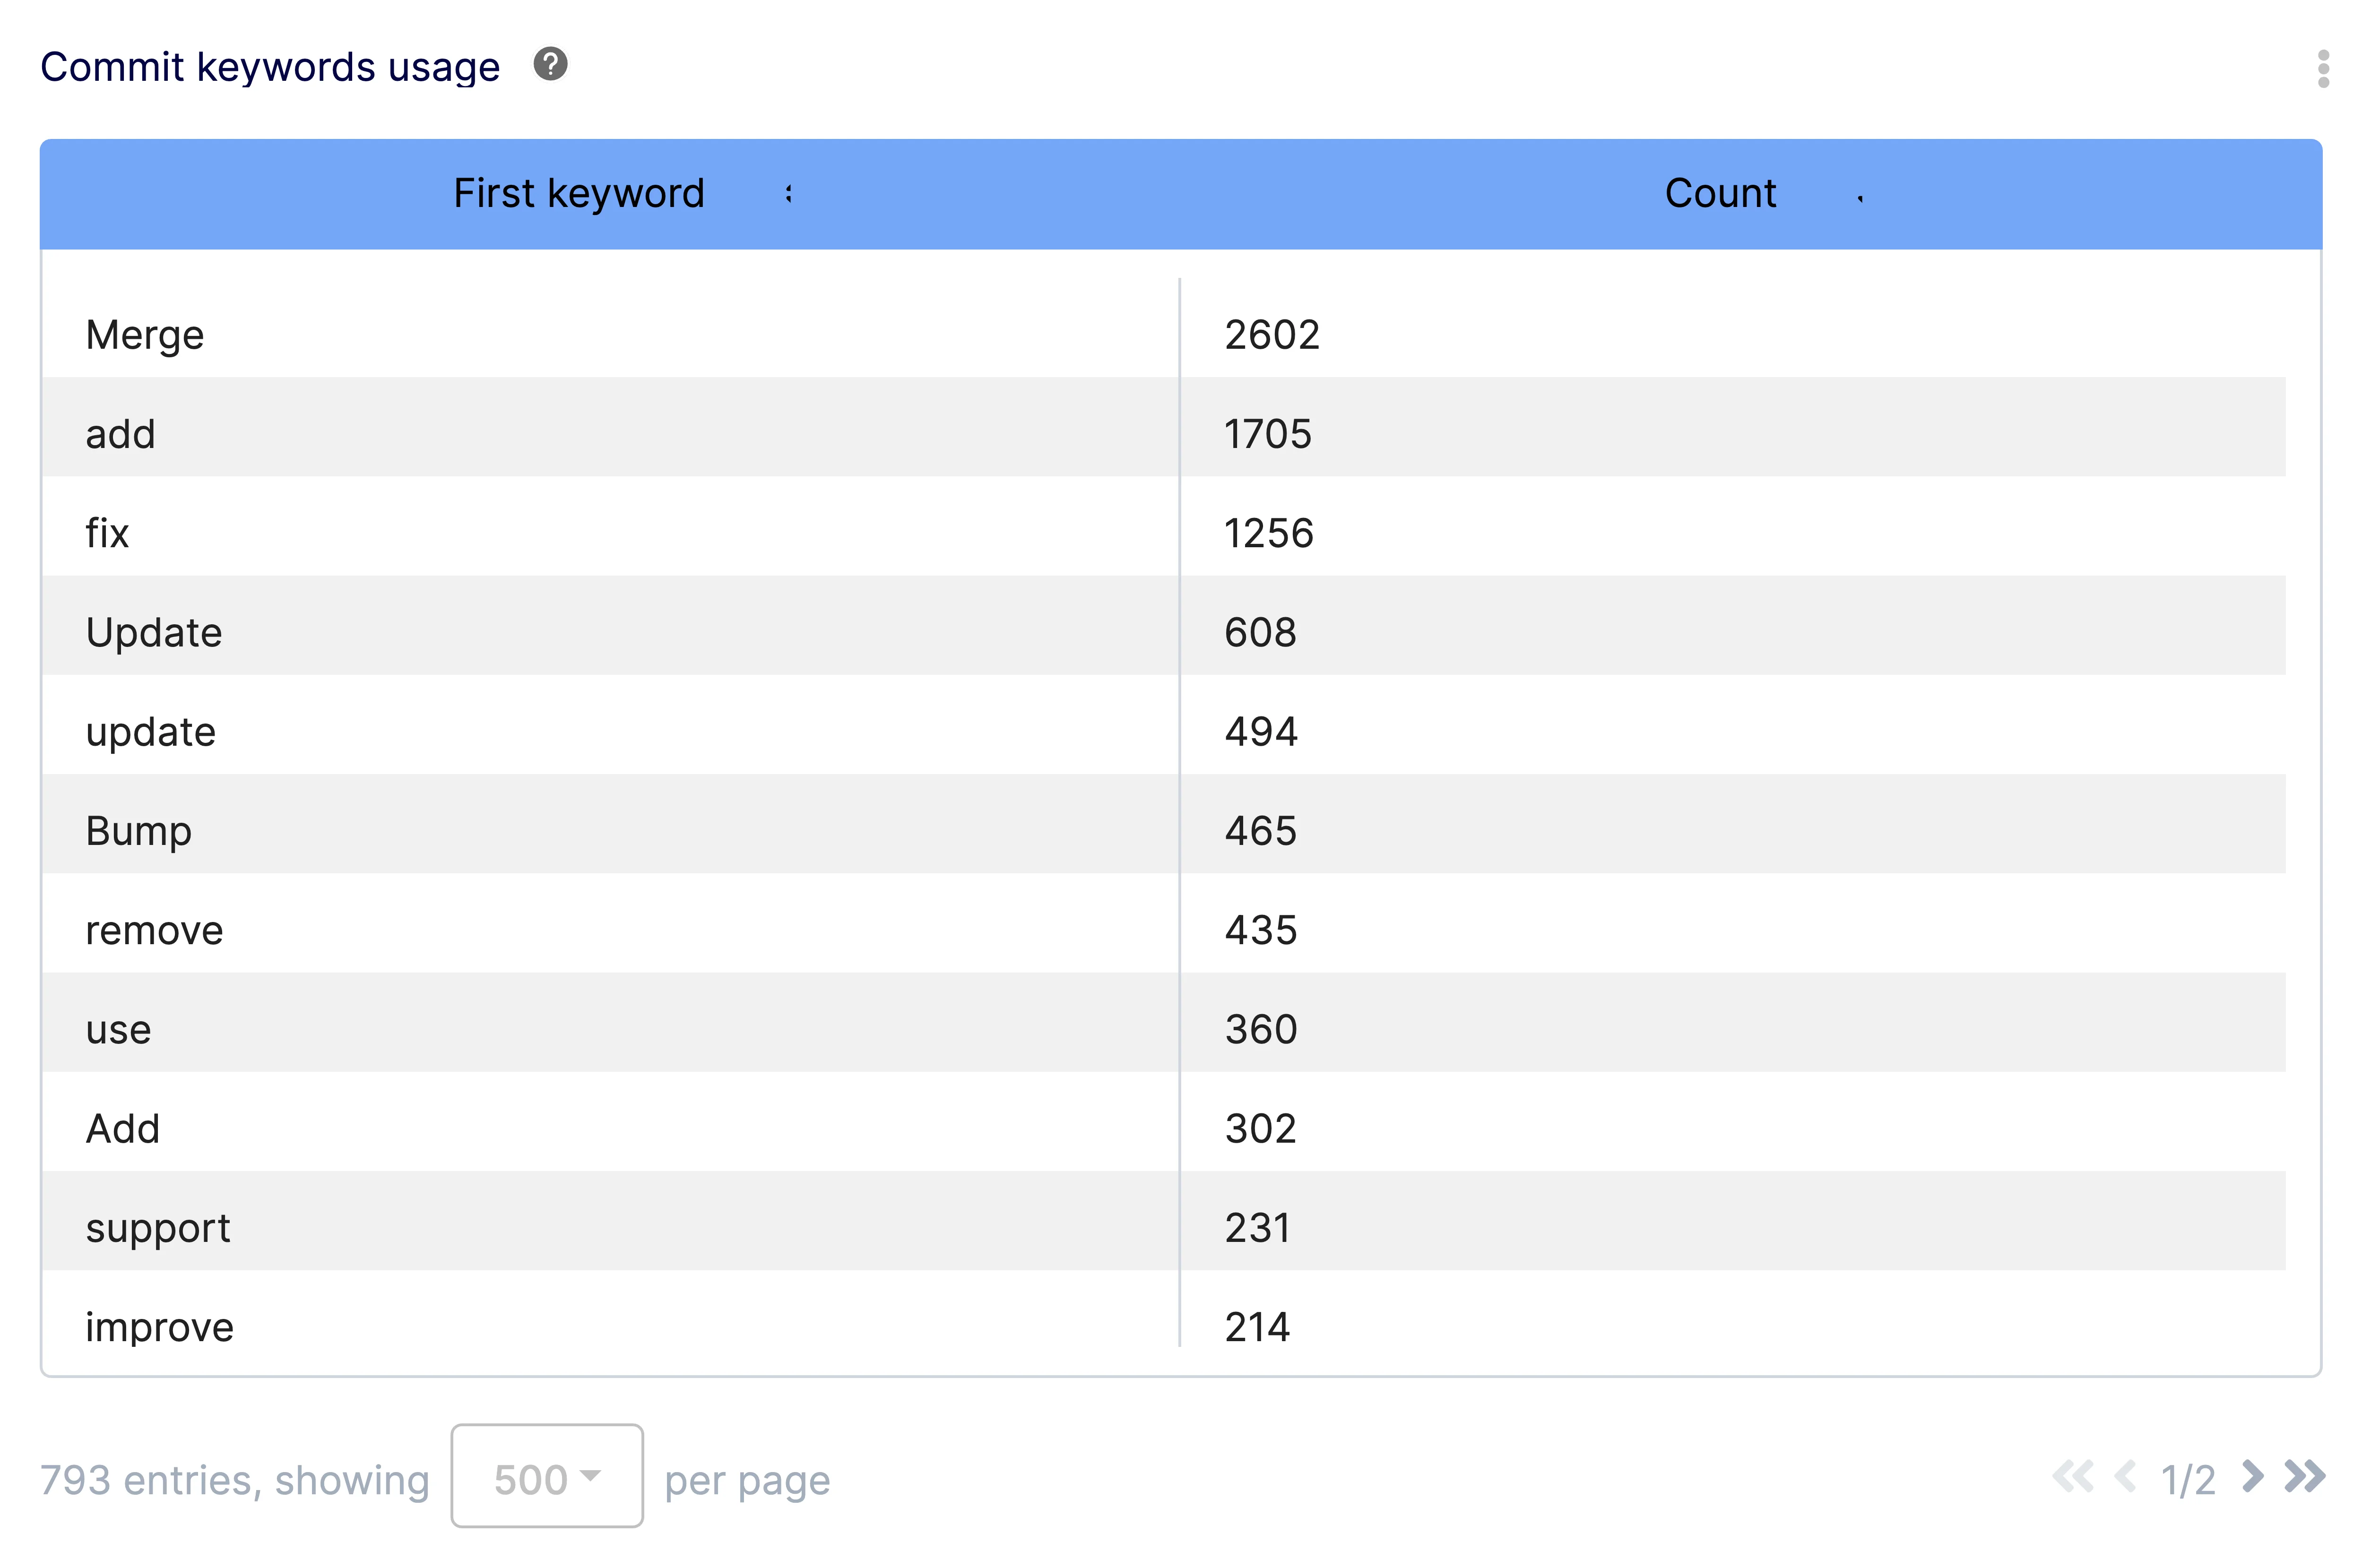
Analyze commit message keywords to understand development focus and adherence to conventional commits.
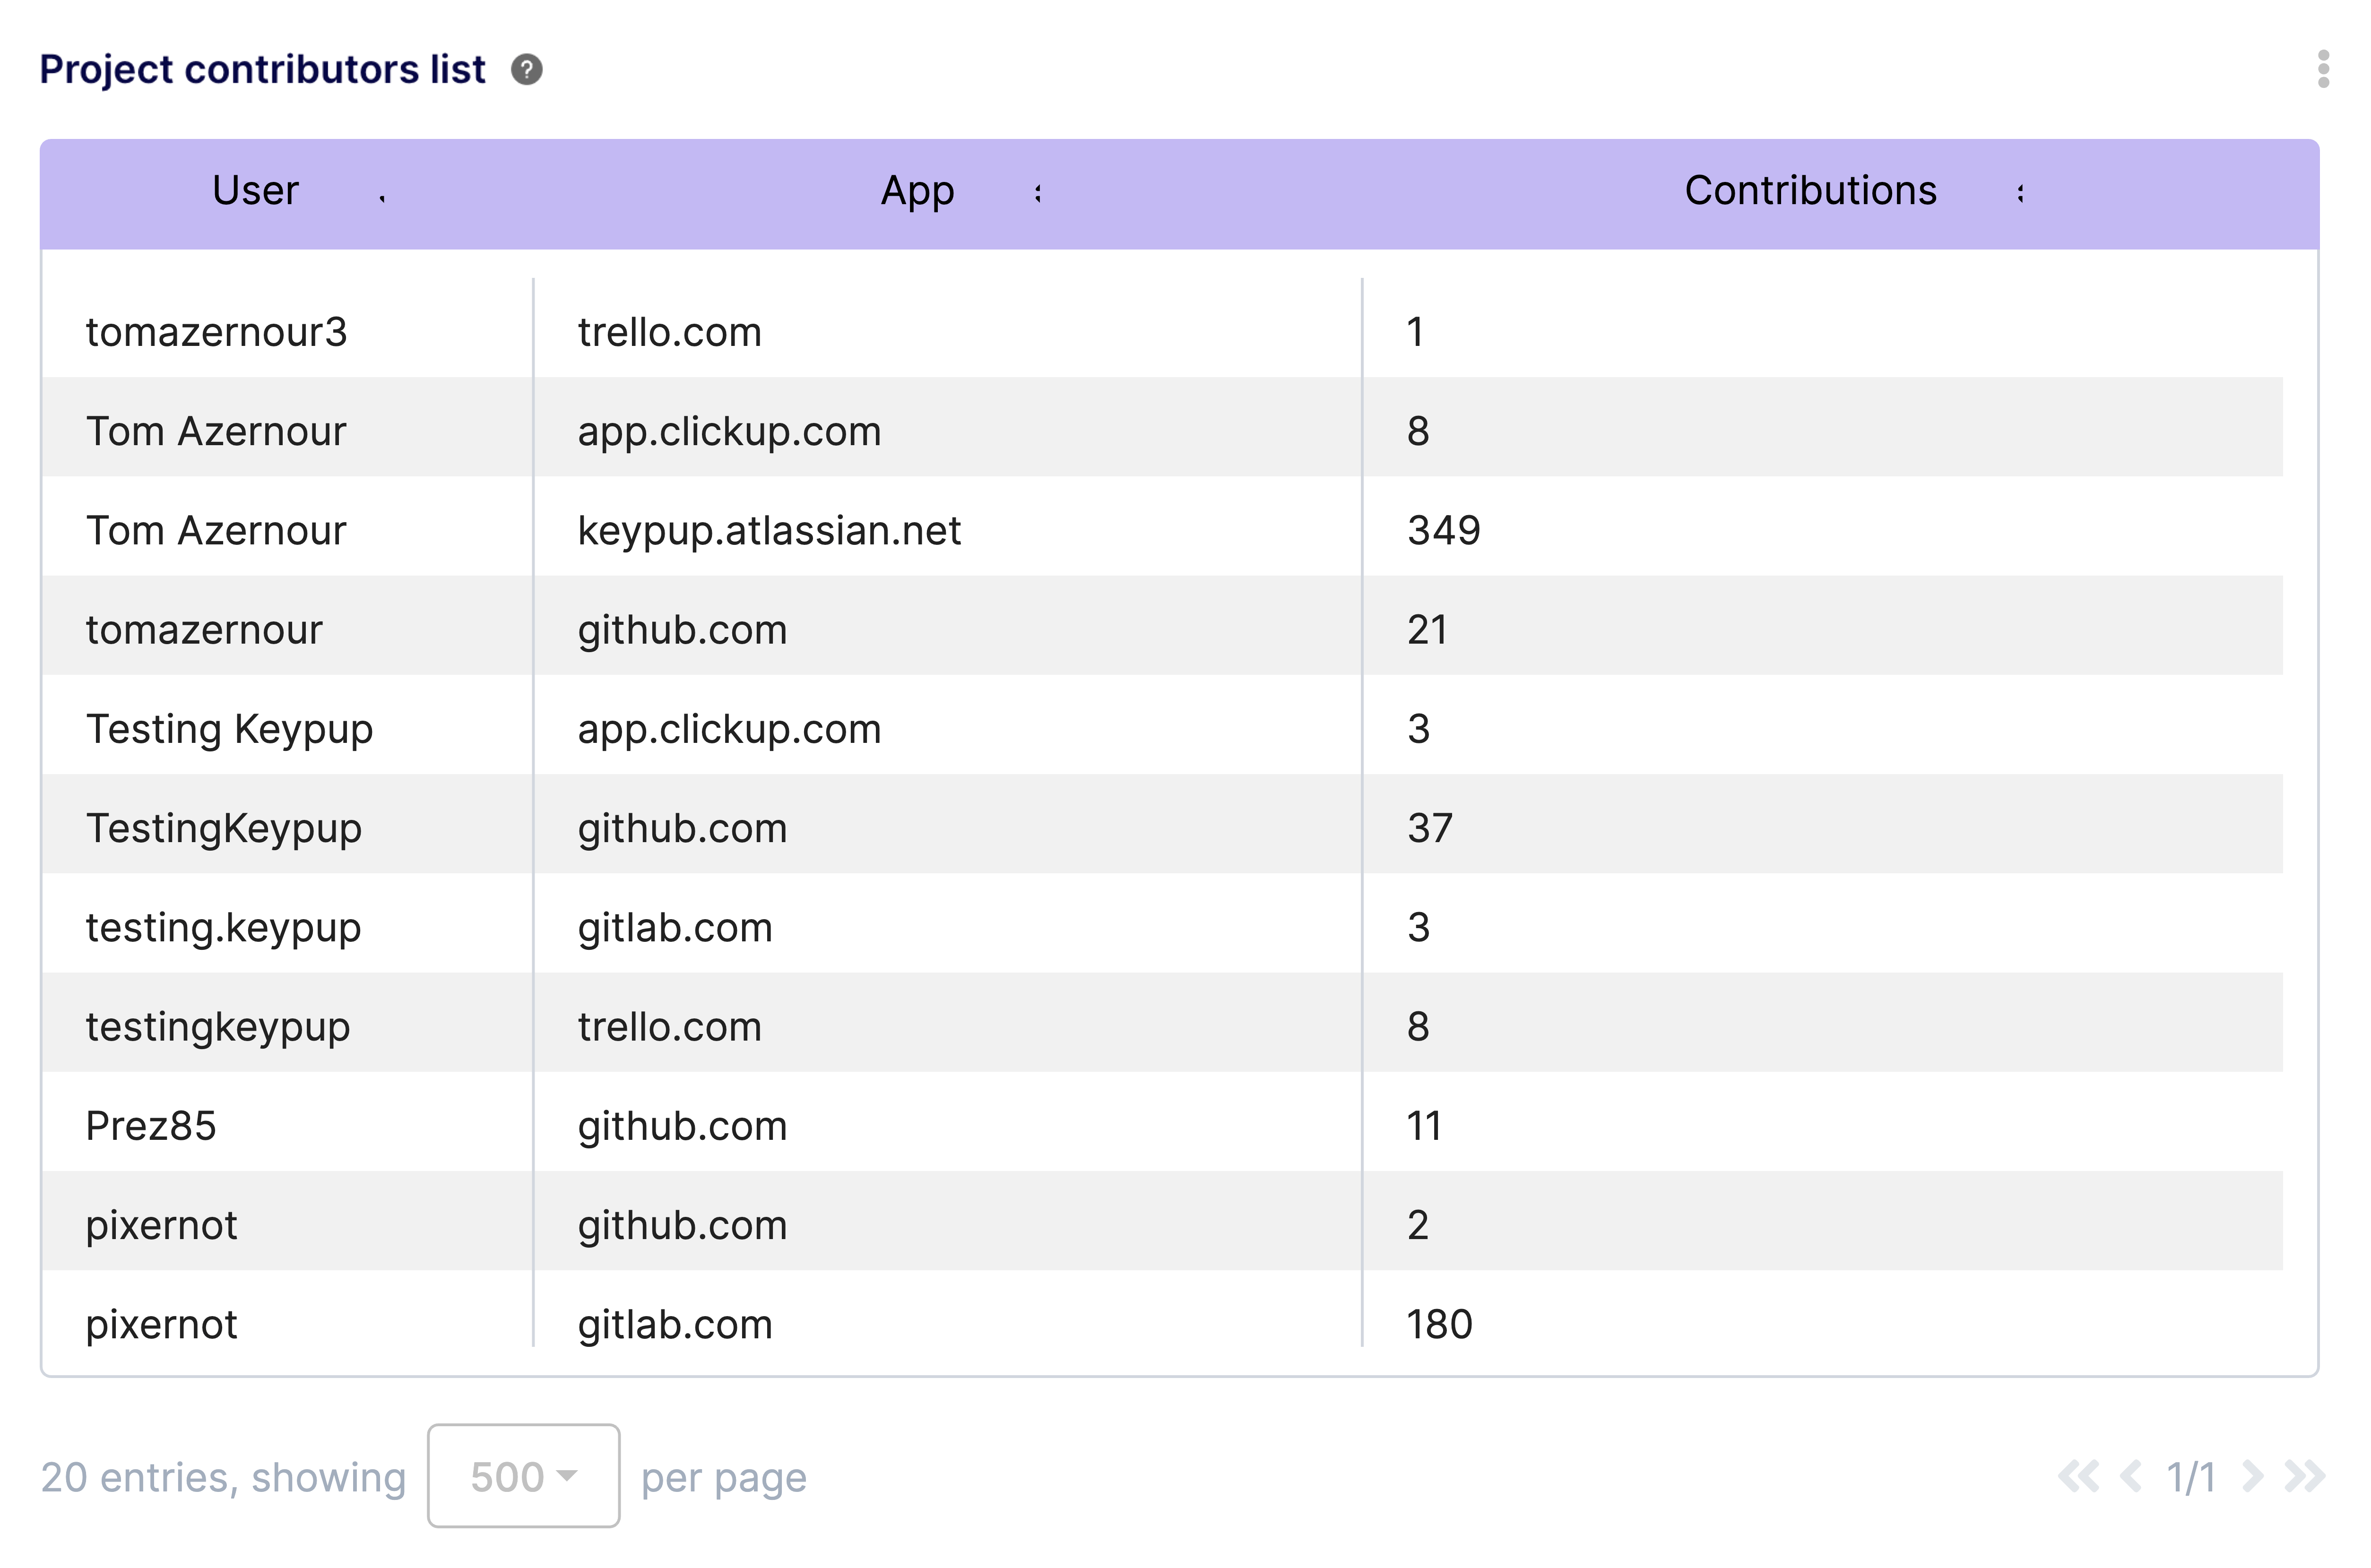
List all project contributors and their activity levels to assess team composition and seniority.
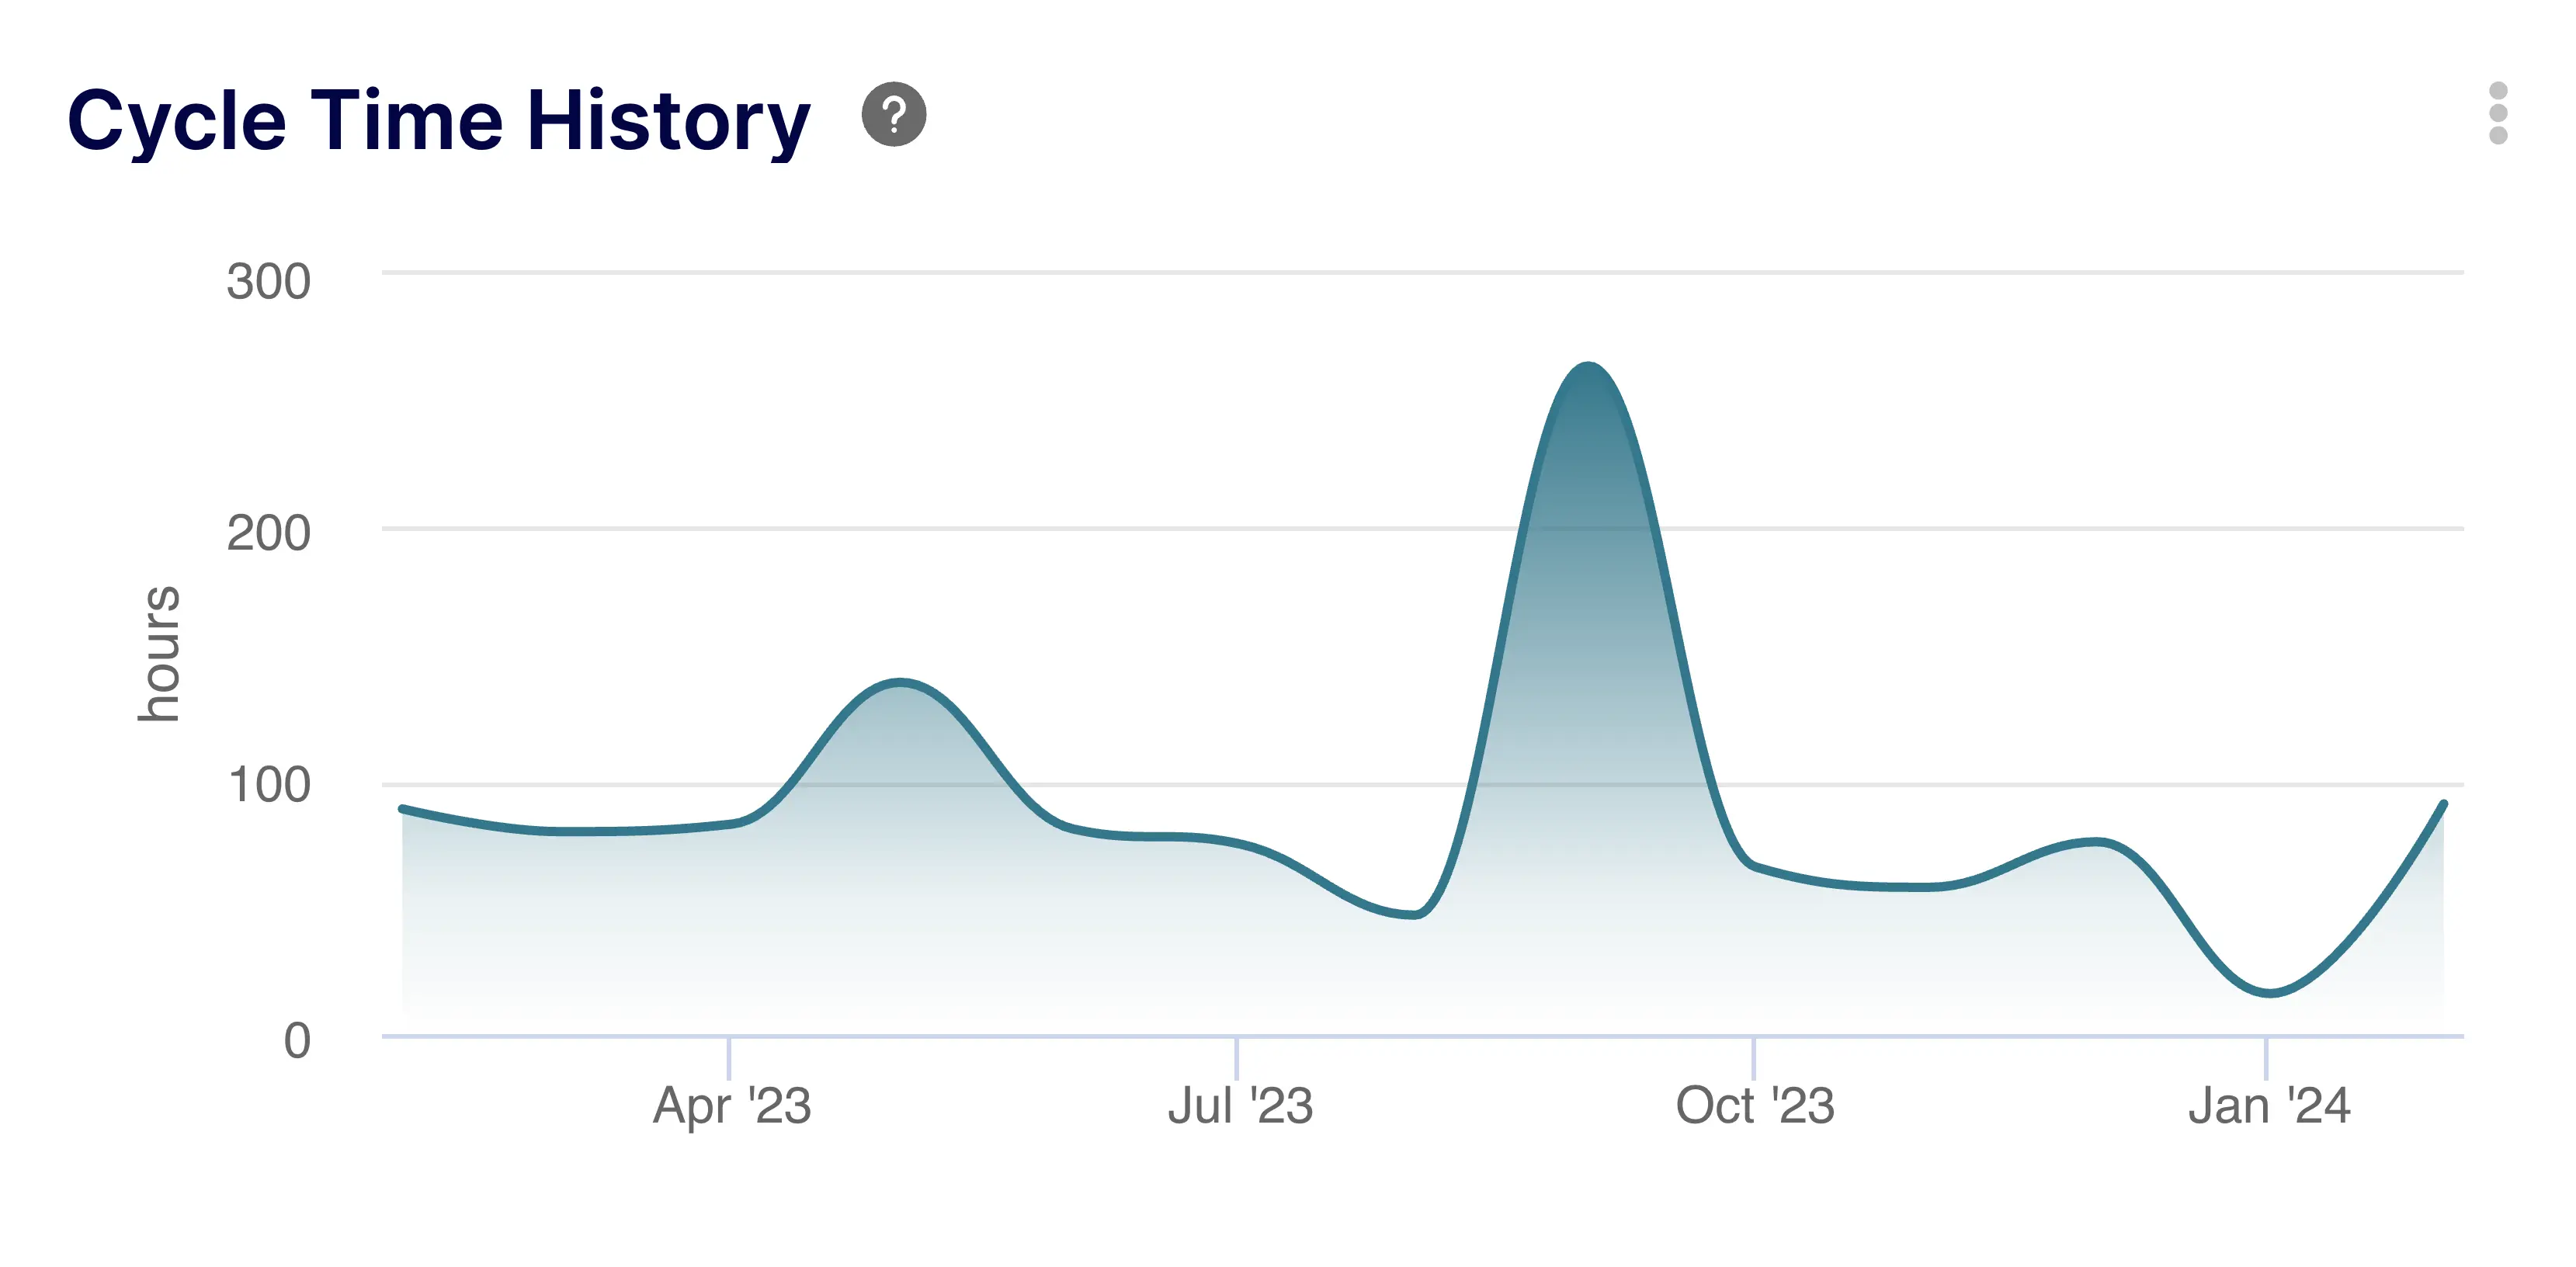
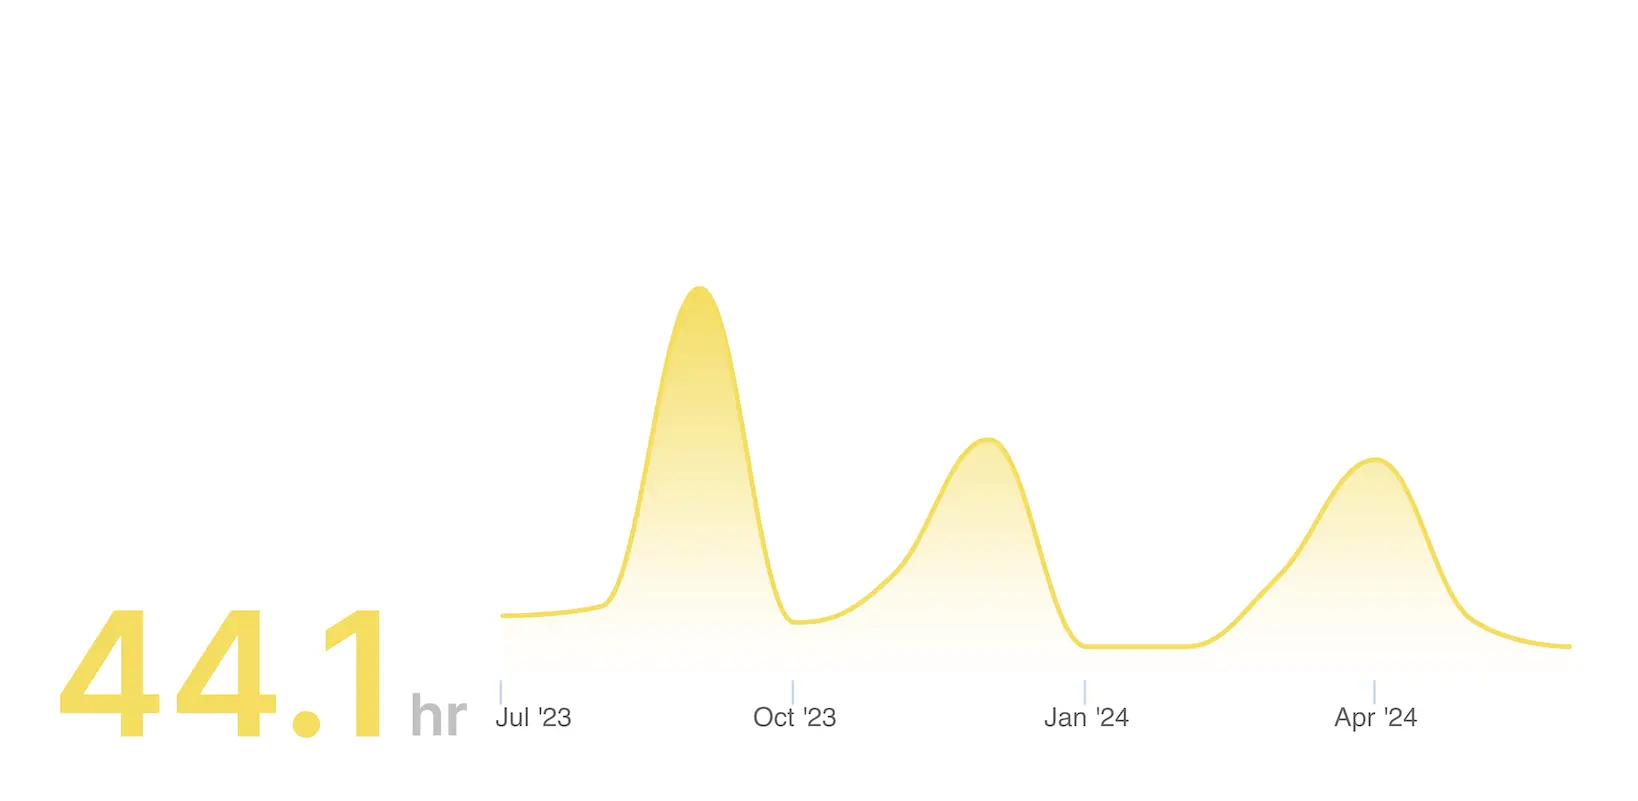
Analyze cycle time trends over previous periods to identify long-term efficiency improvements or bottlenecks.
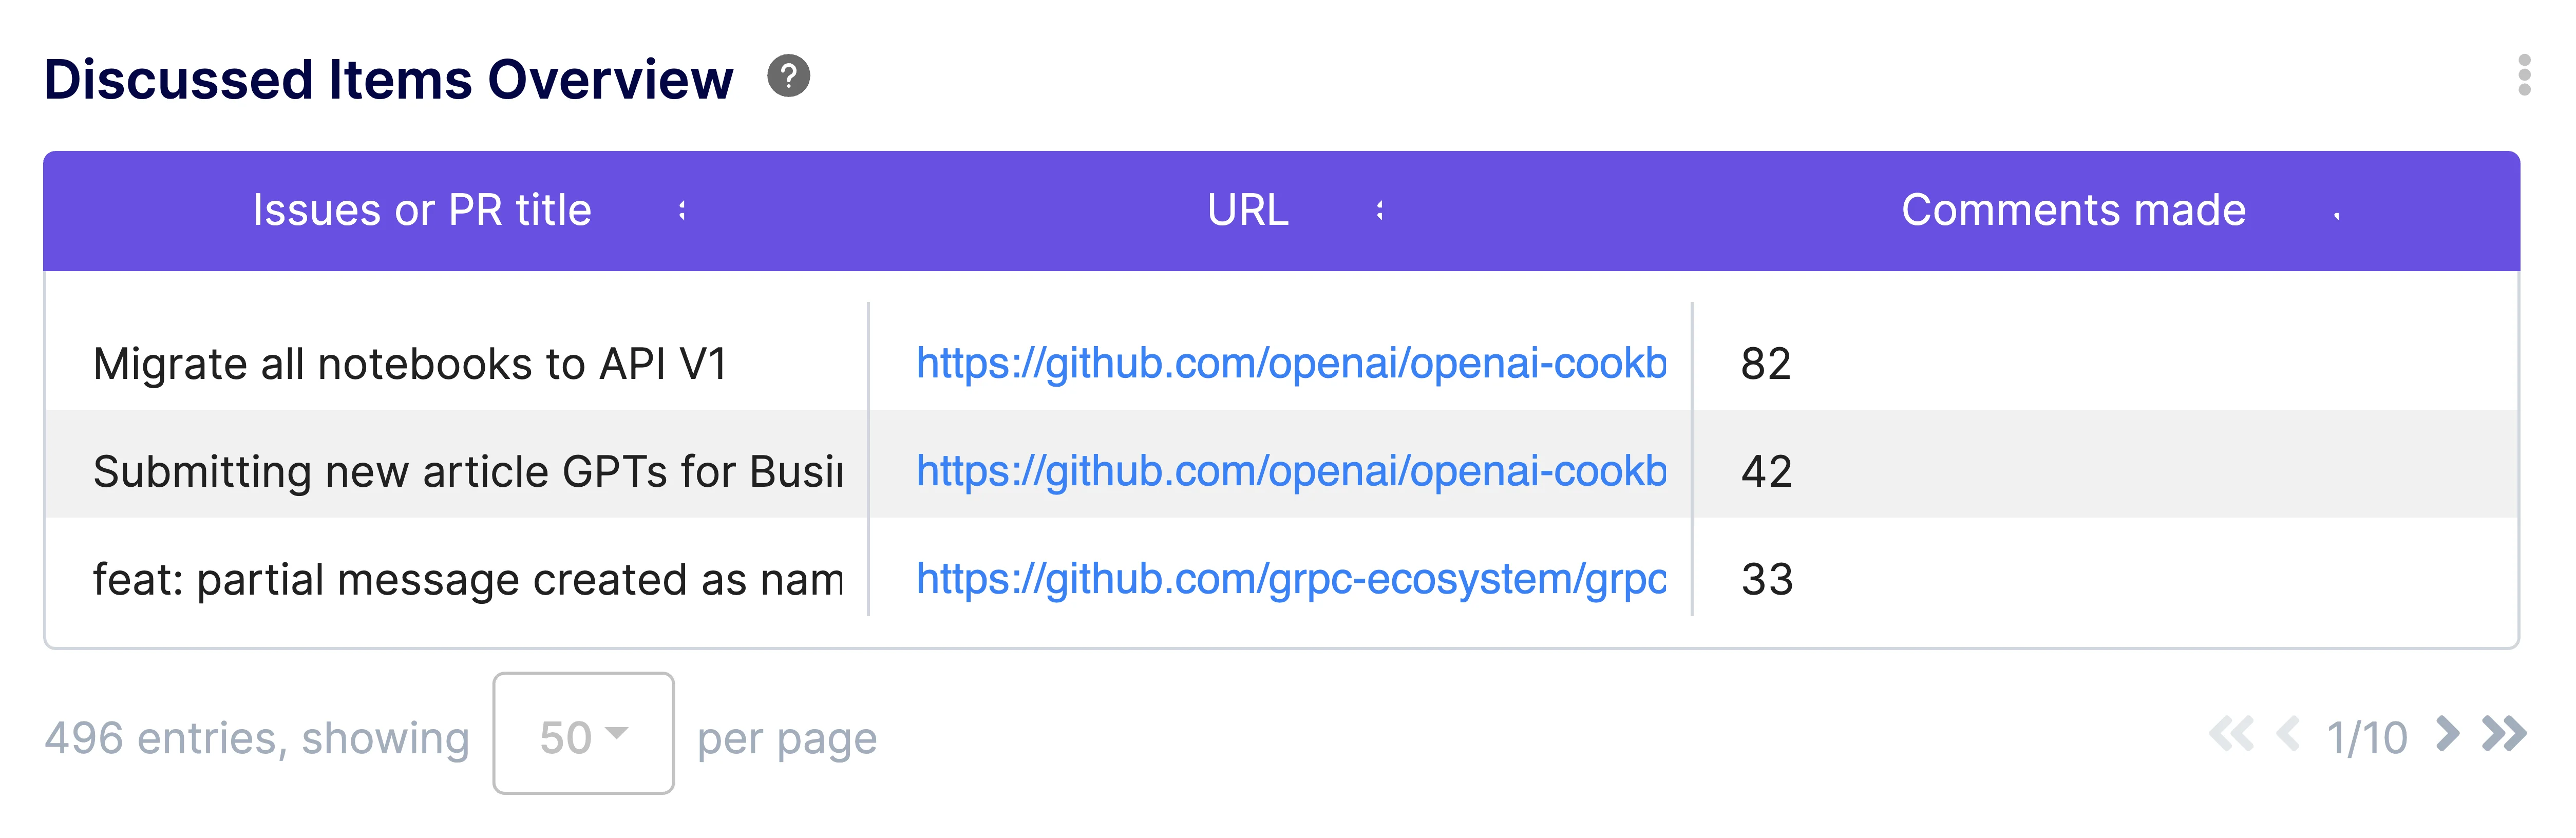
Track the items generating the most discussion to identify complex tasks or potential blockers.
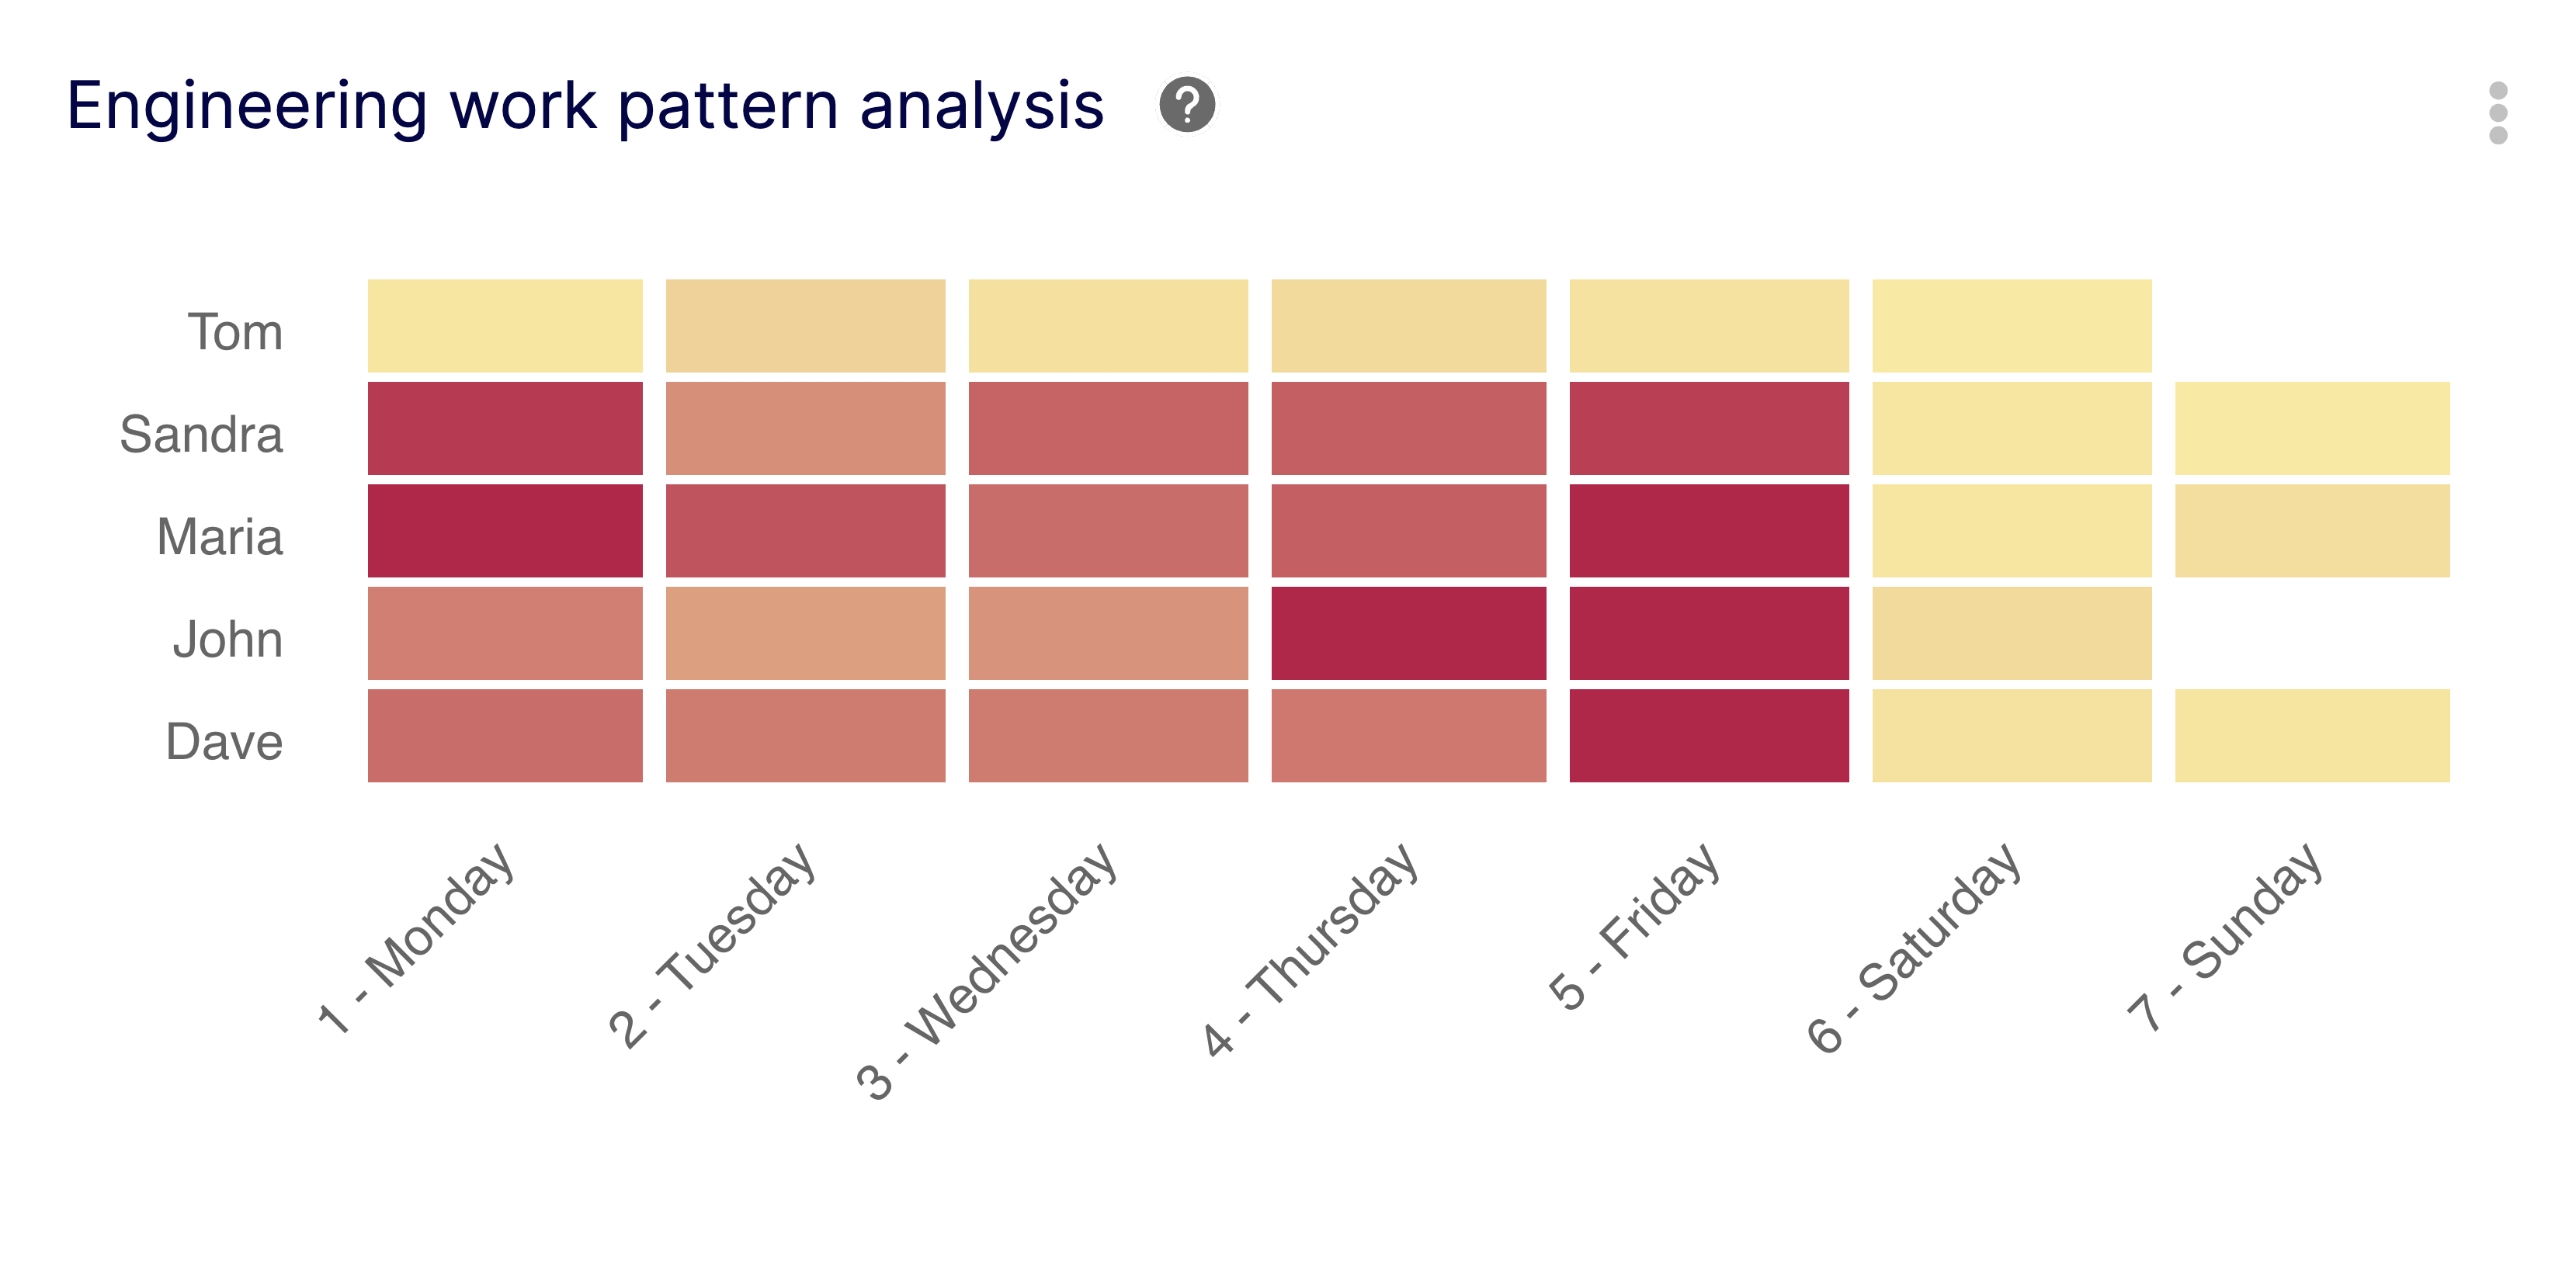
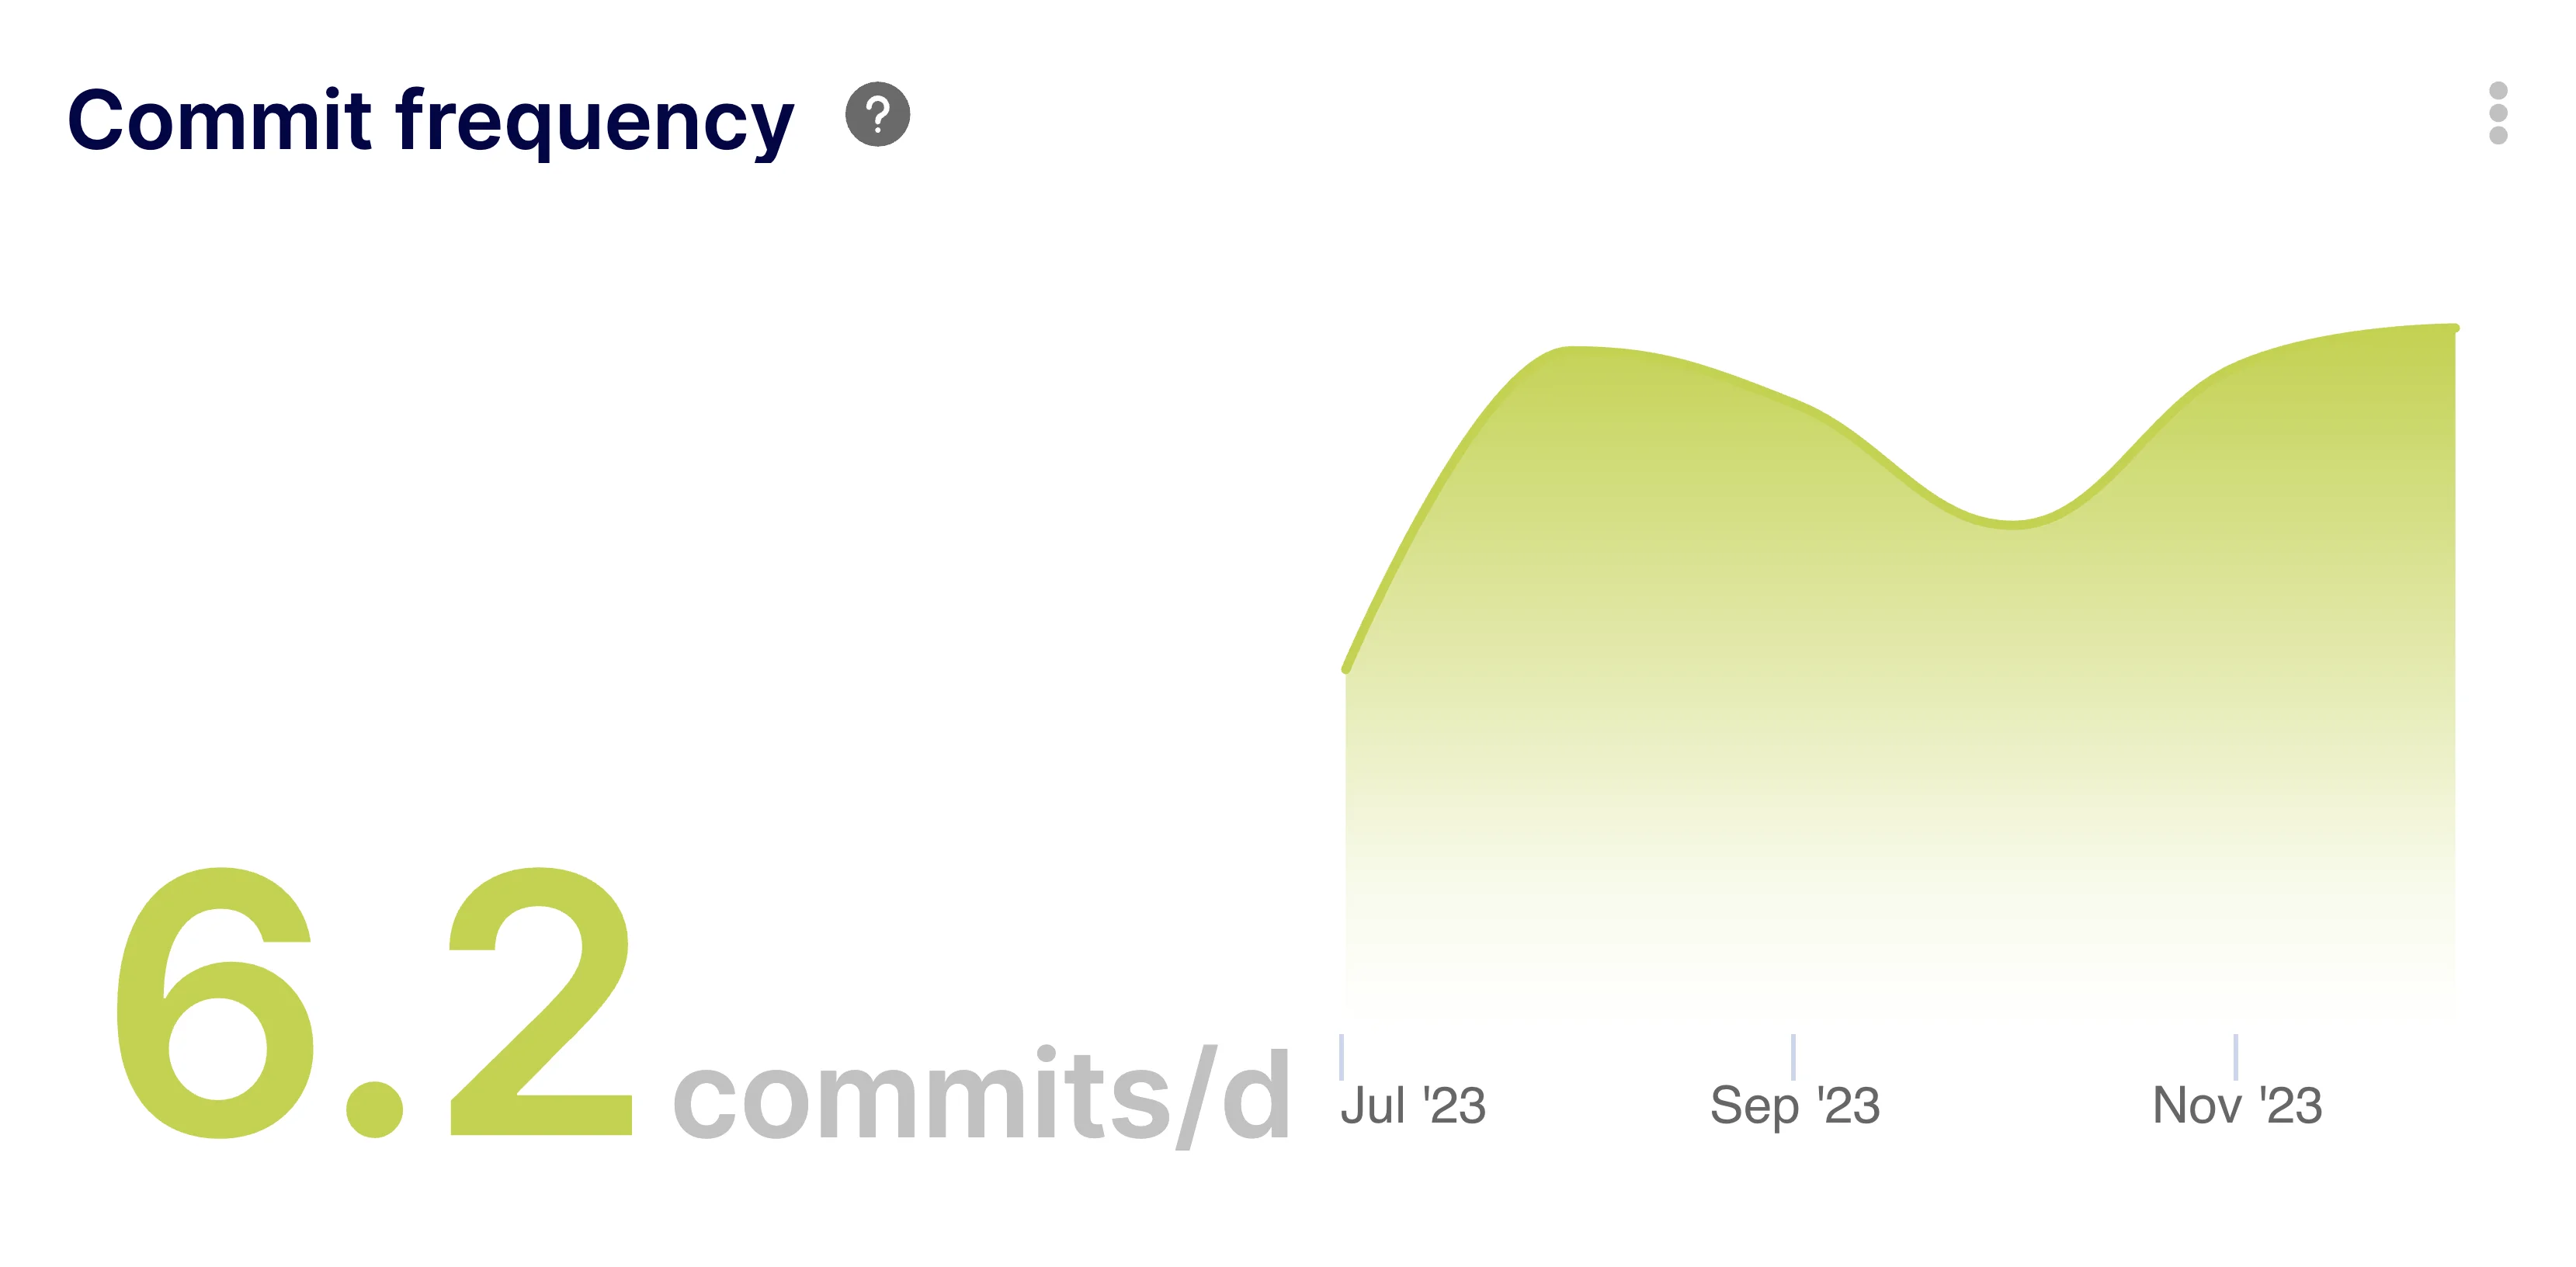
Analyze daily commit patterns to understand team work habits and development velocity.
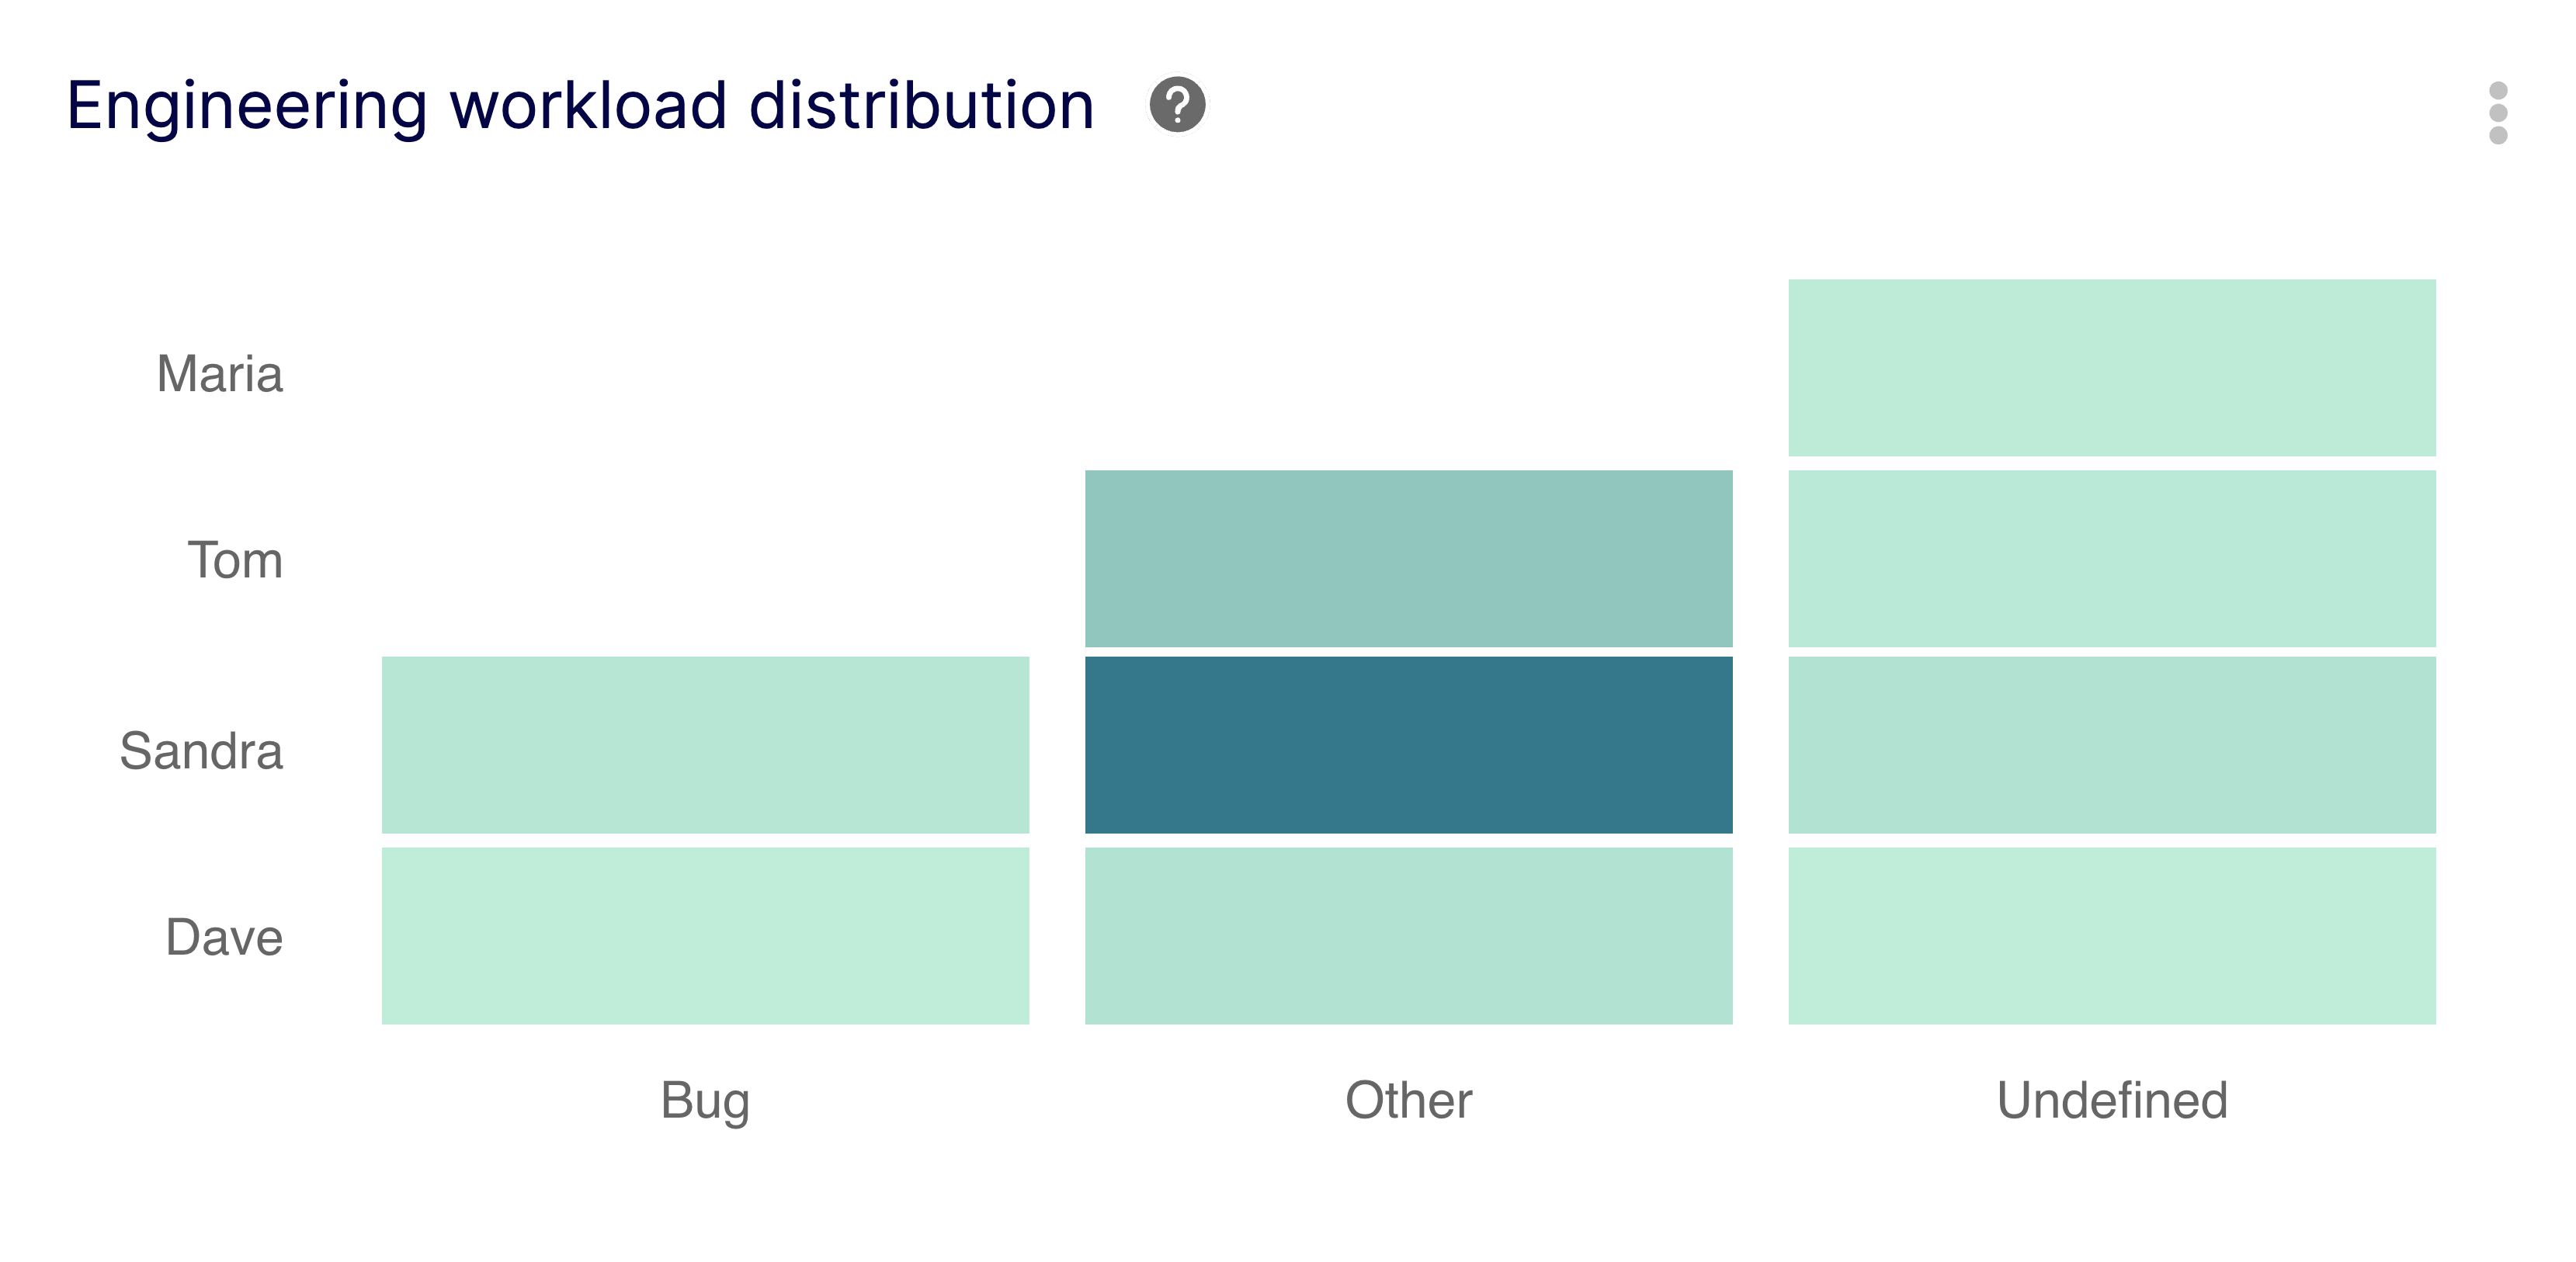
Visualize task distribution across engineers to ensure a balanced and effective workload.
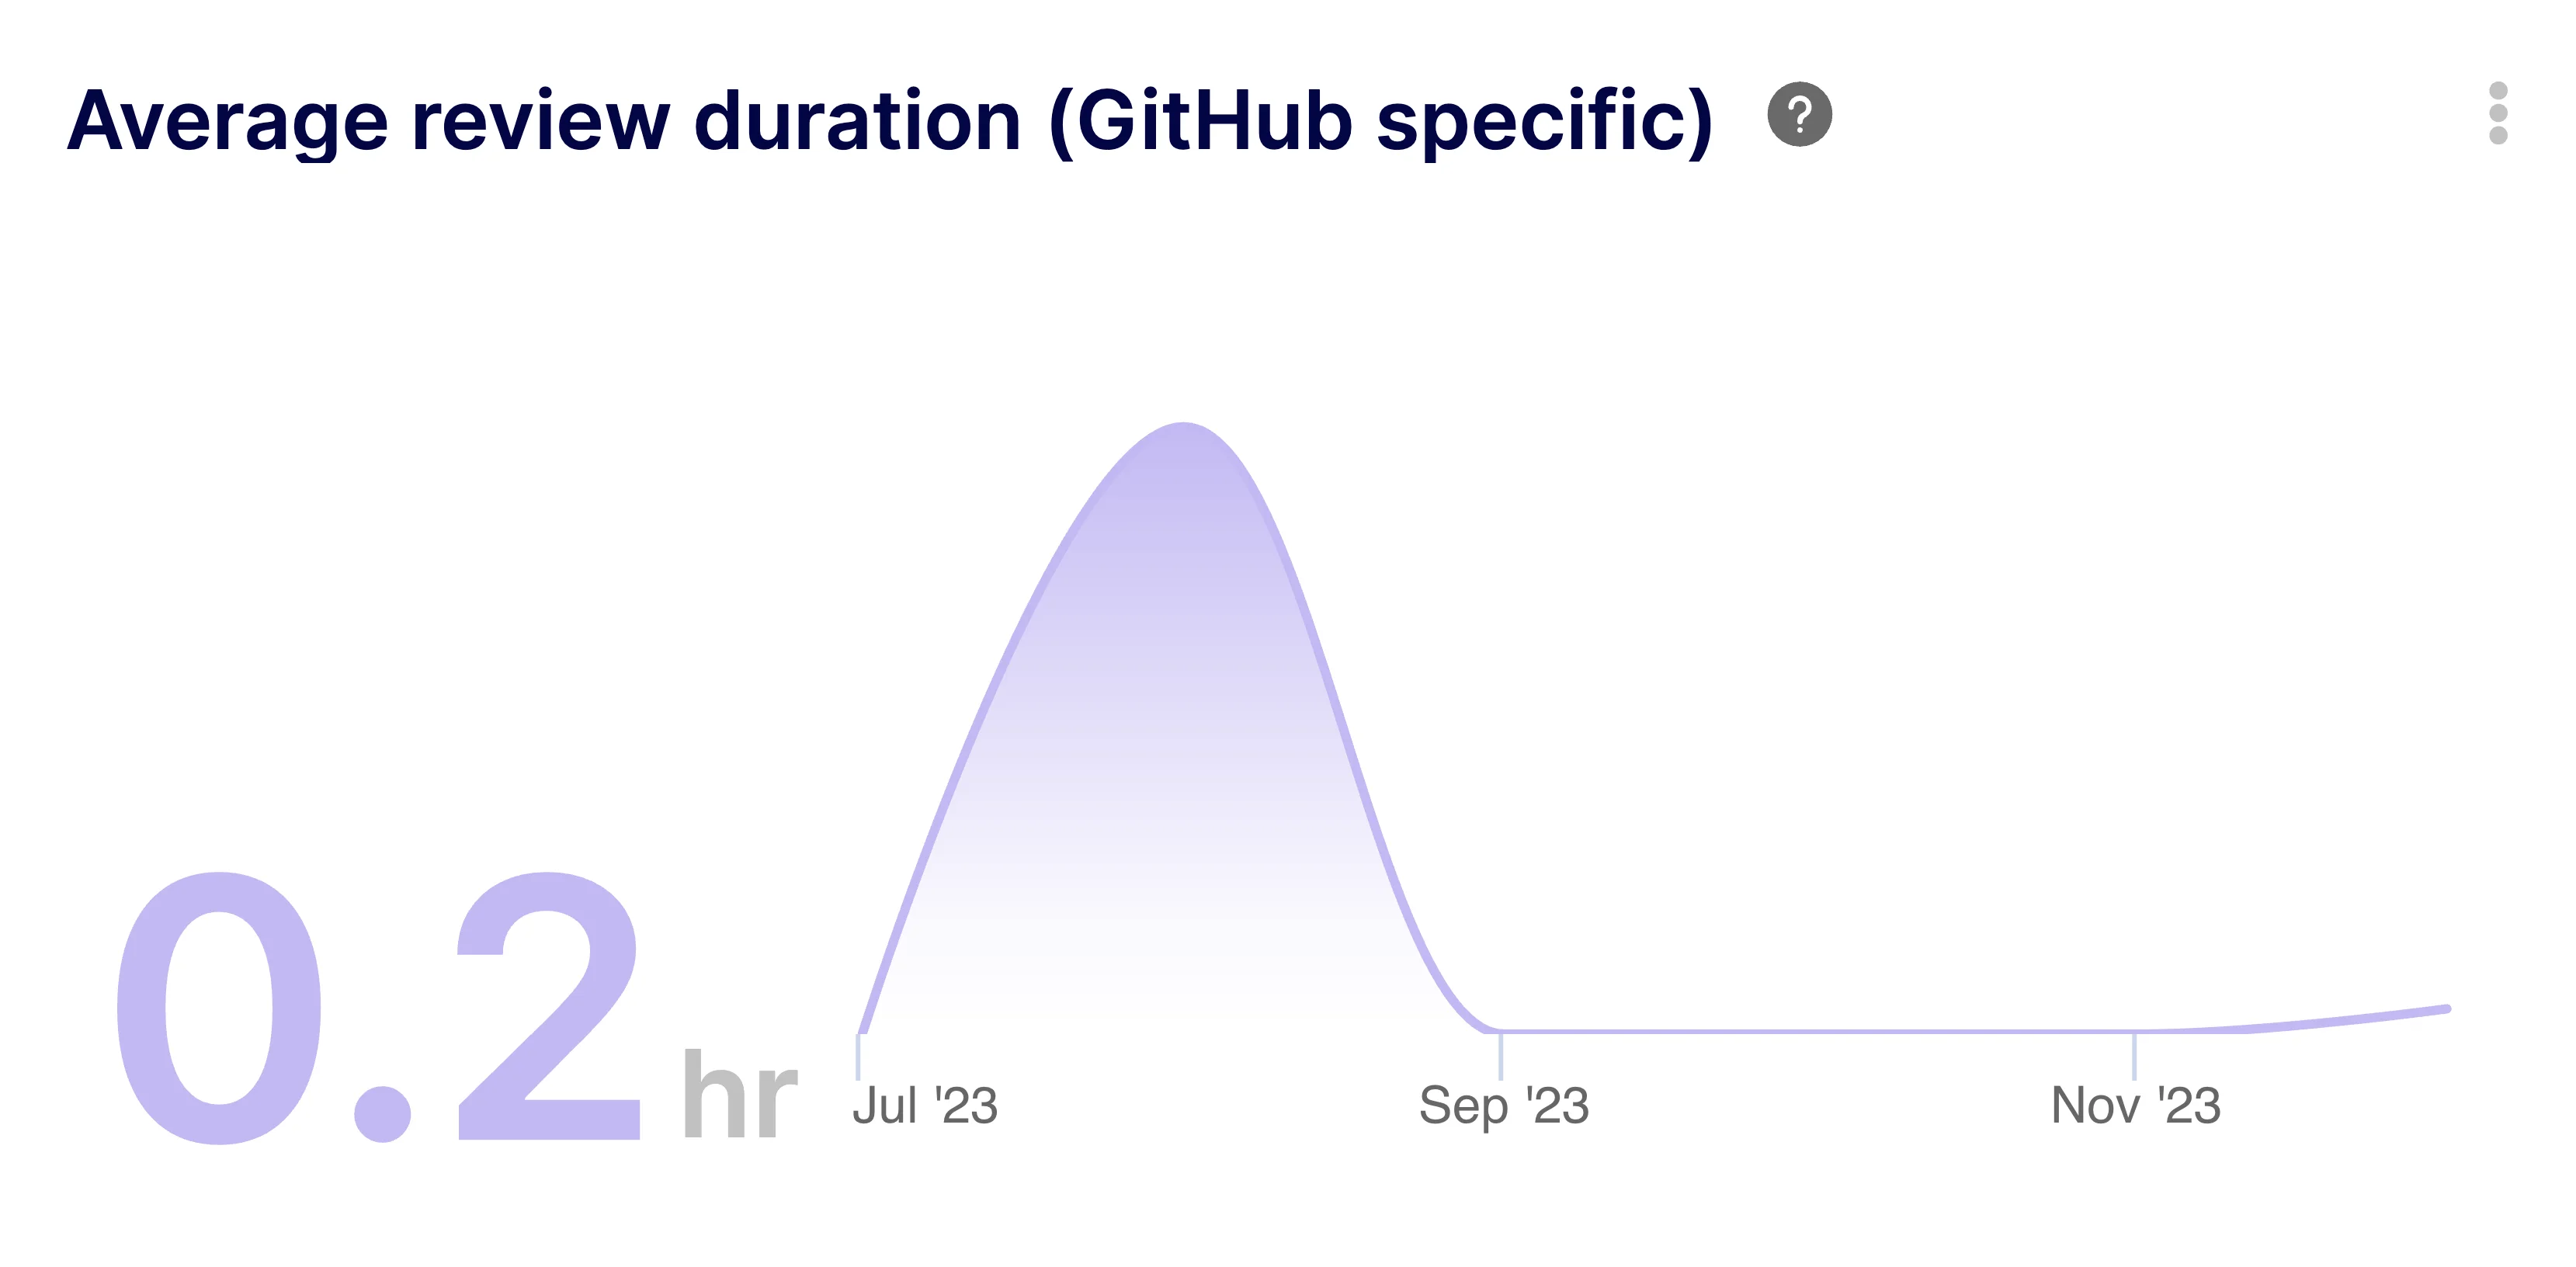
Measure how long individual reviews take to identify coaching opportunities or complex code areas.
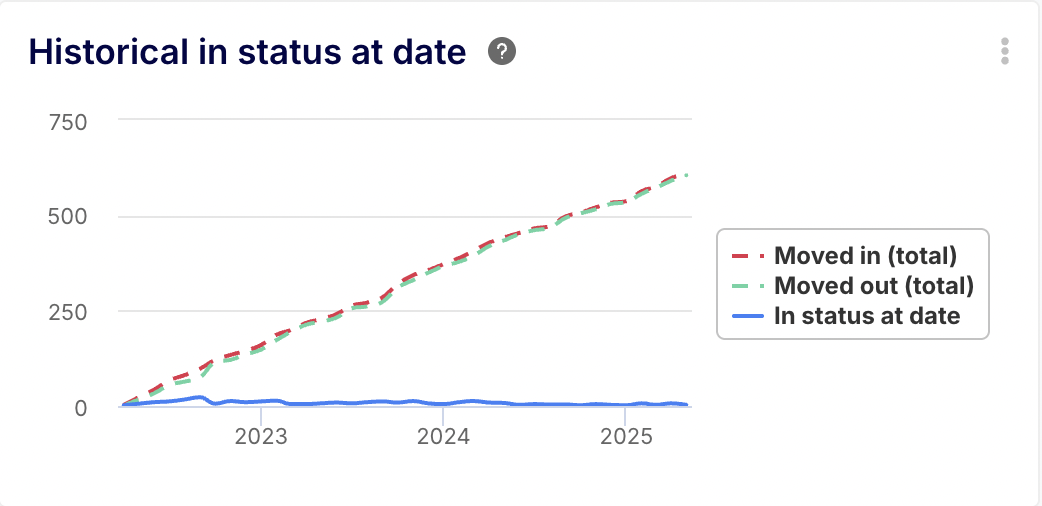
Analyze historical status trends to understand how work items move through your workflow over time.
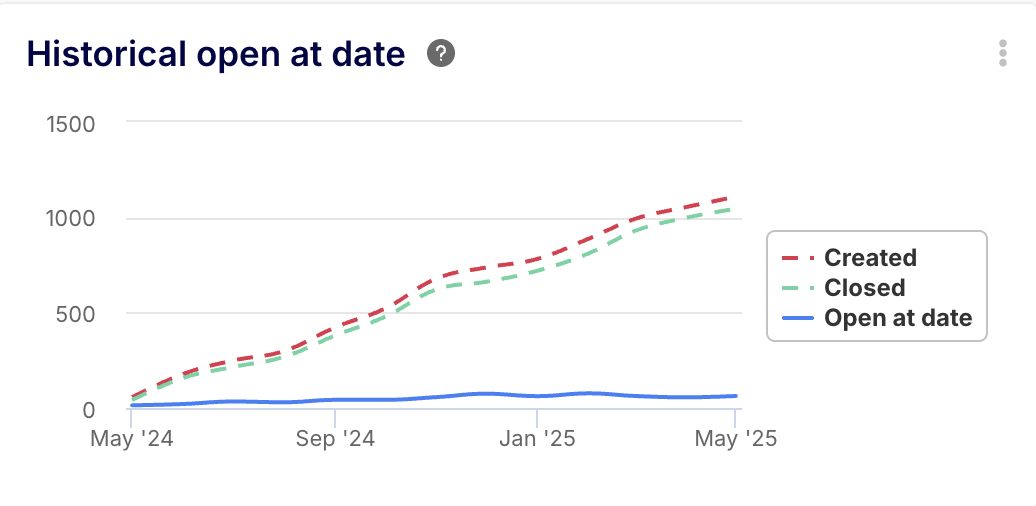
Track the volume of open items historically to spot backlog accumulation or process improvements.
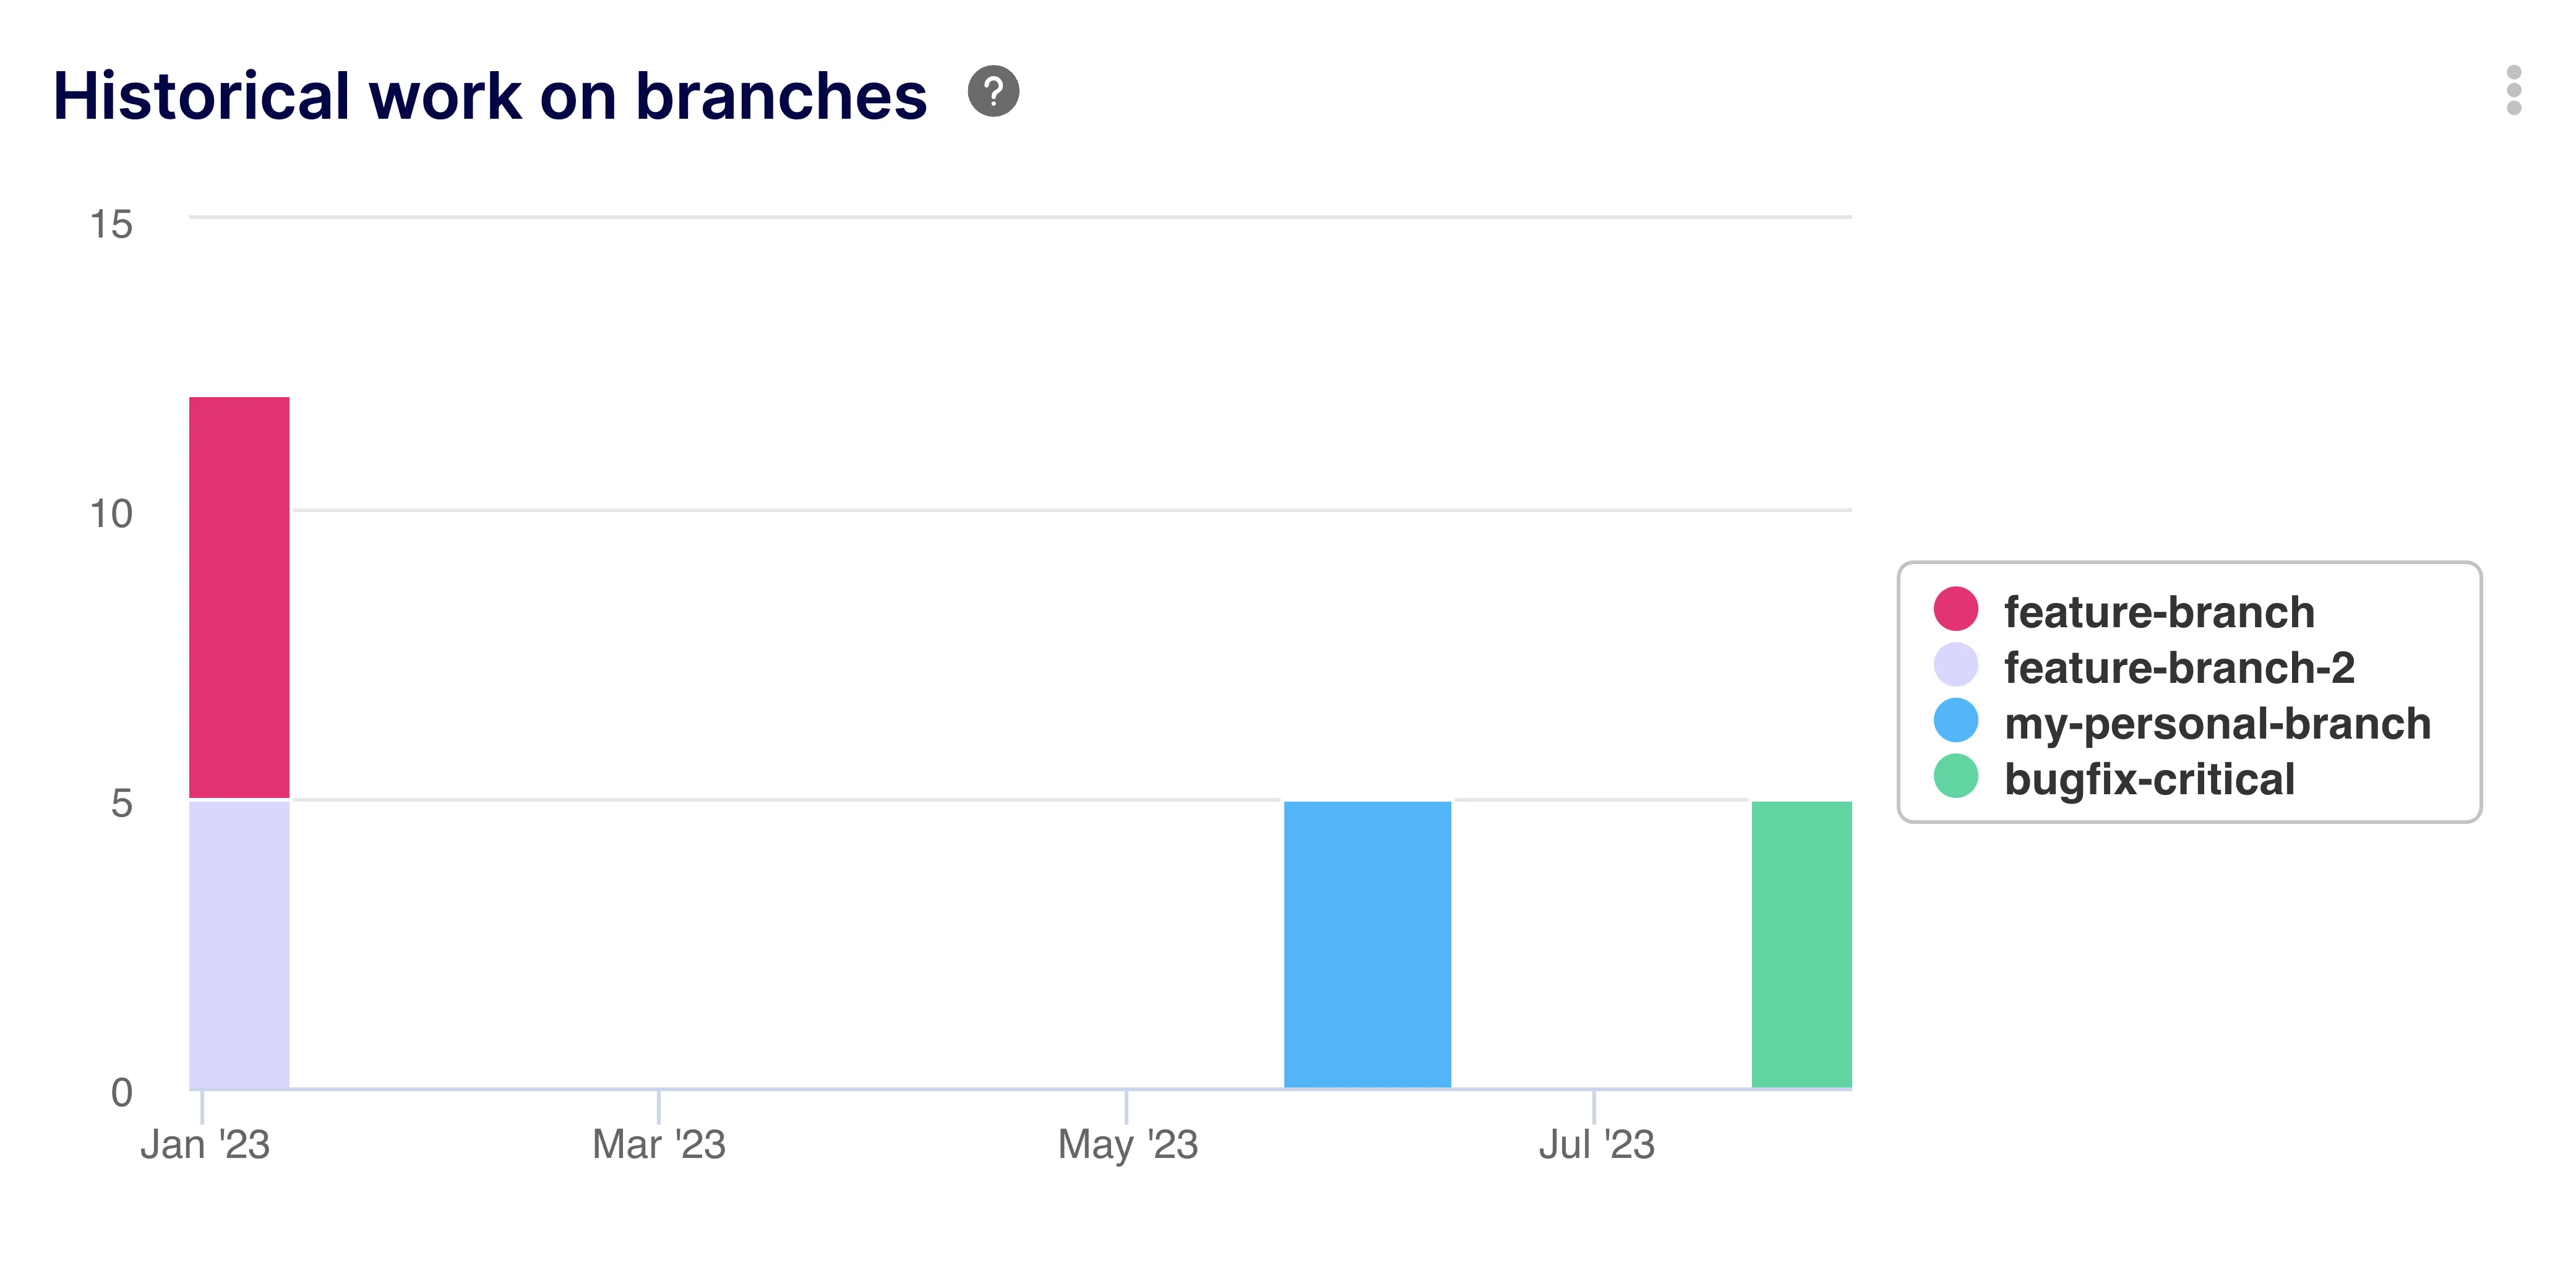
Monitor branch activity over time to visualize parallel work streams and development intensity.
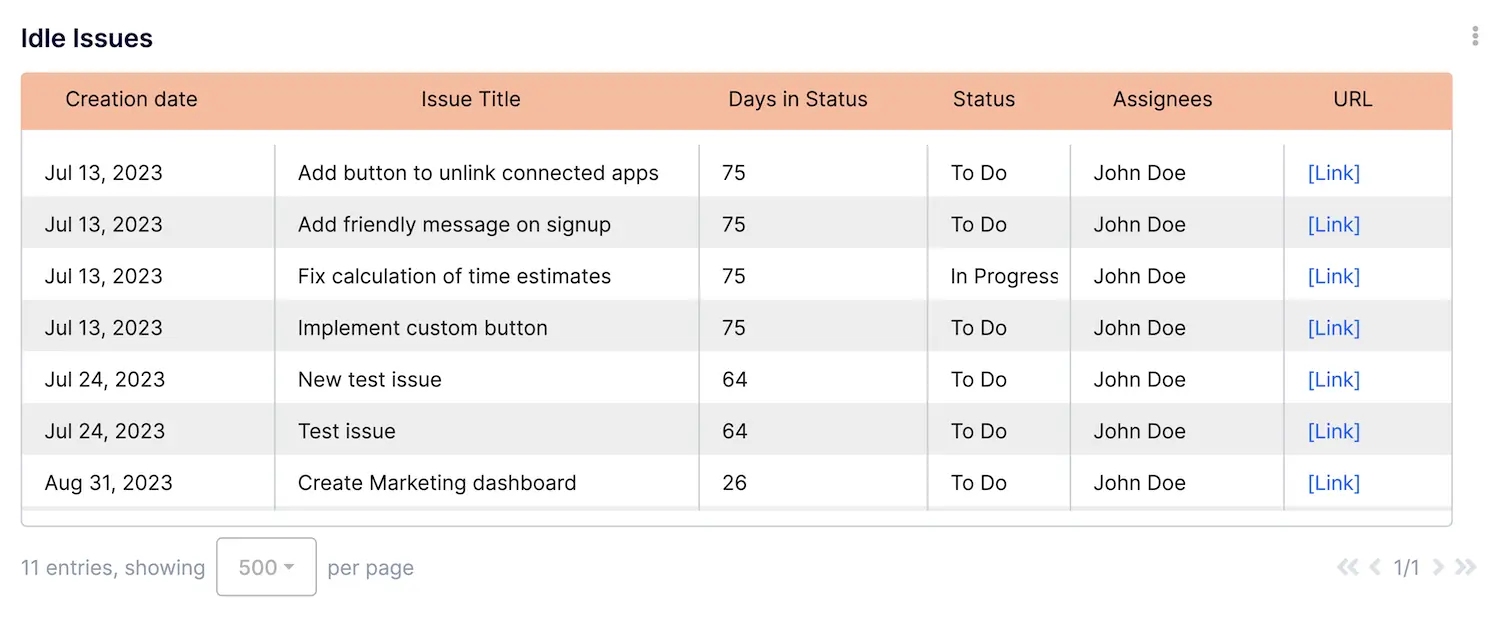
Identify stale or blocked issues to keep your backlog moving and reduce cycle time.
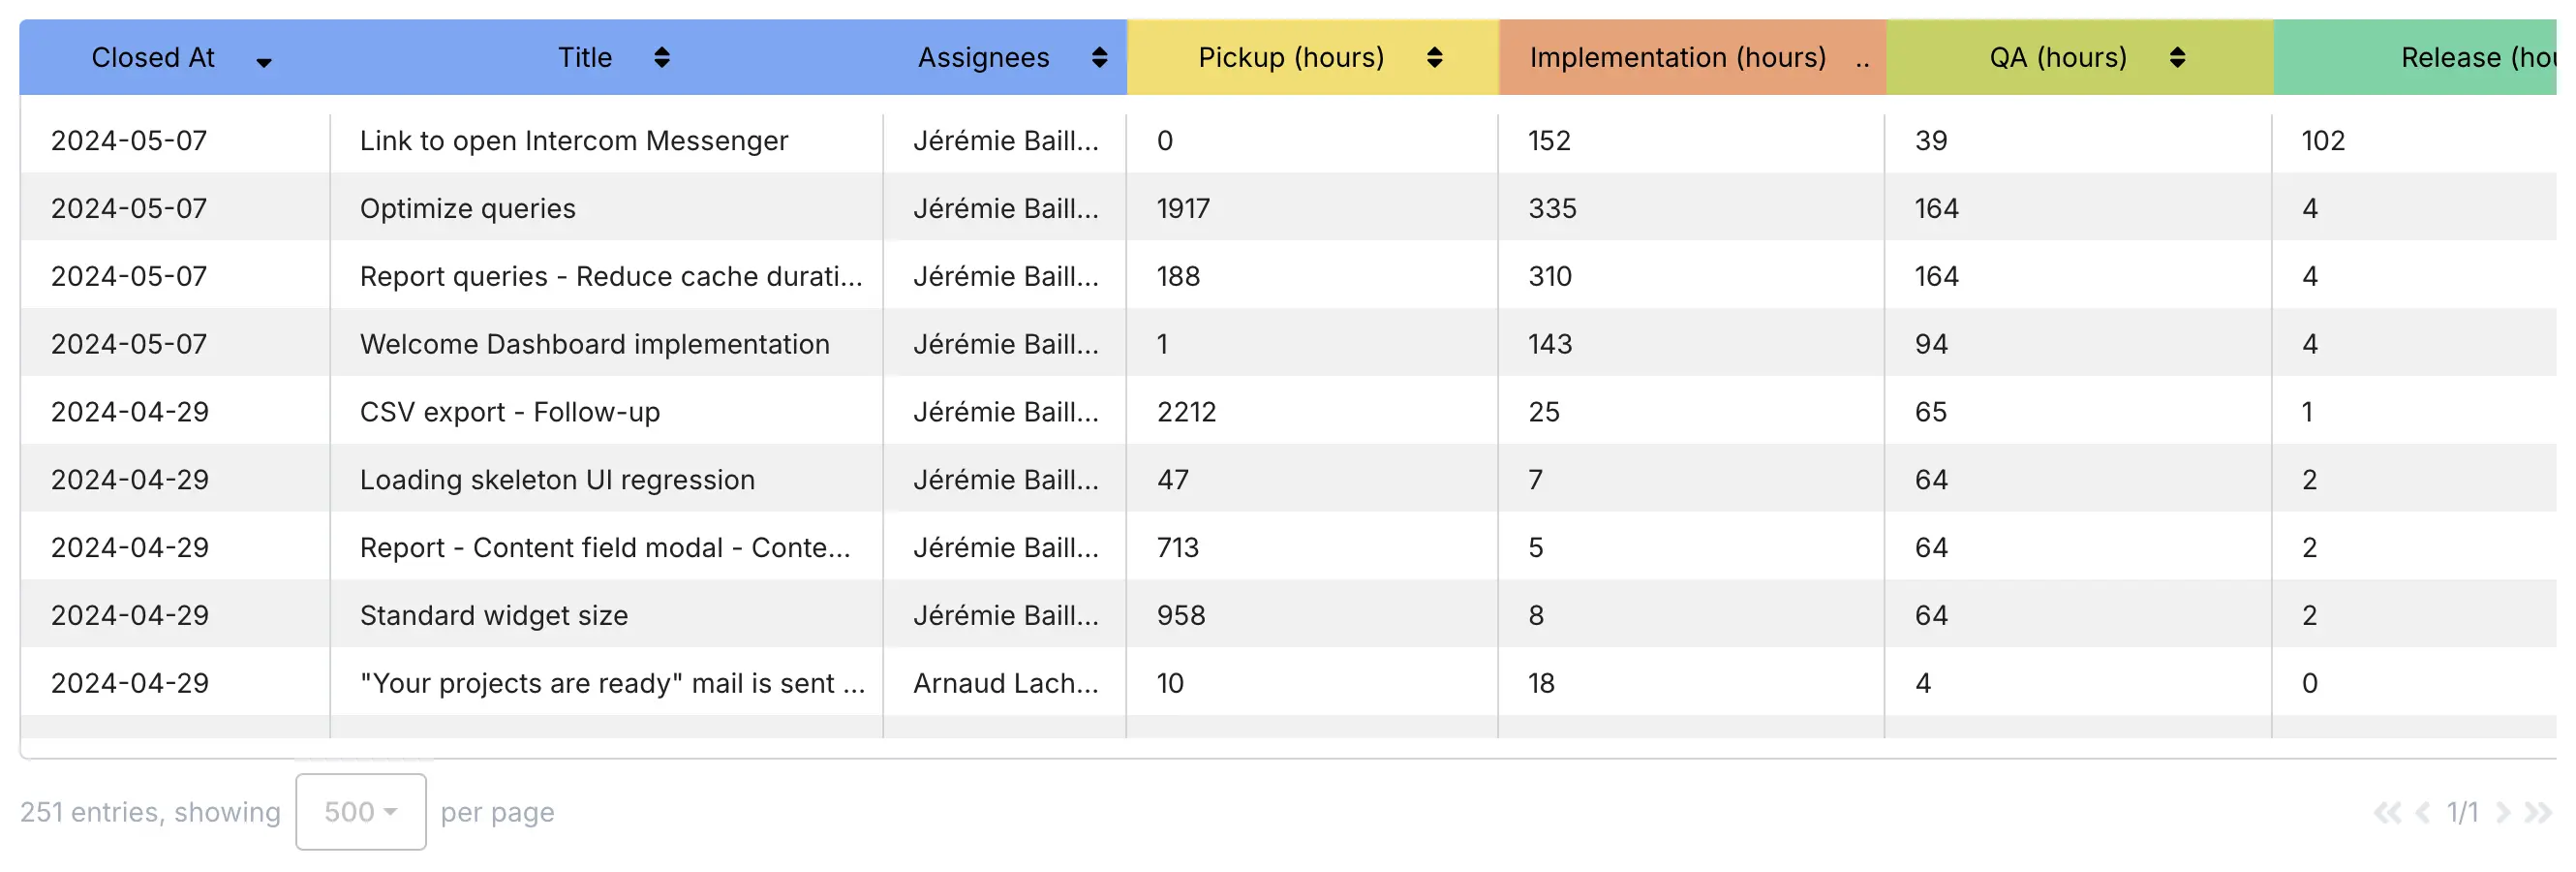
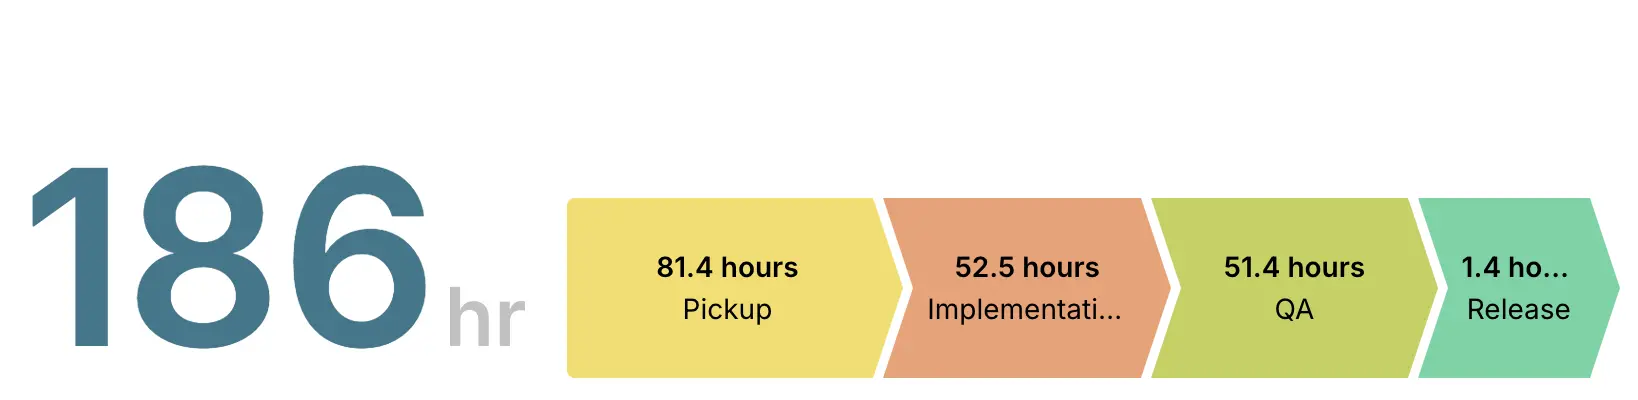
Break down issue lifecycle duration by status to pinpoint exactly where delays occur.
Get a high-level view of how long issues take from creation to completion to measure overall efficiency.
Measure the time spent actively coding on issues to evaluate development speed and complexity.
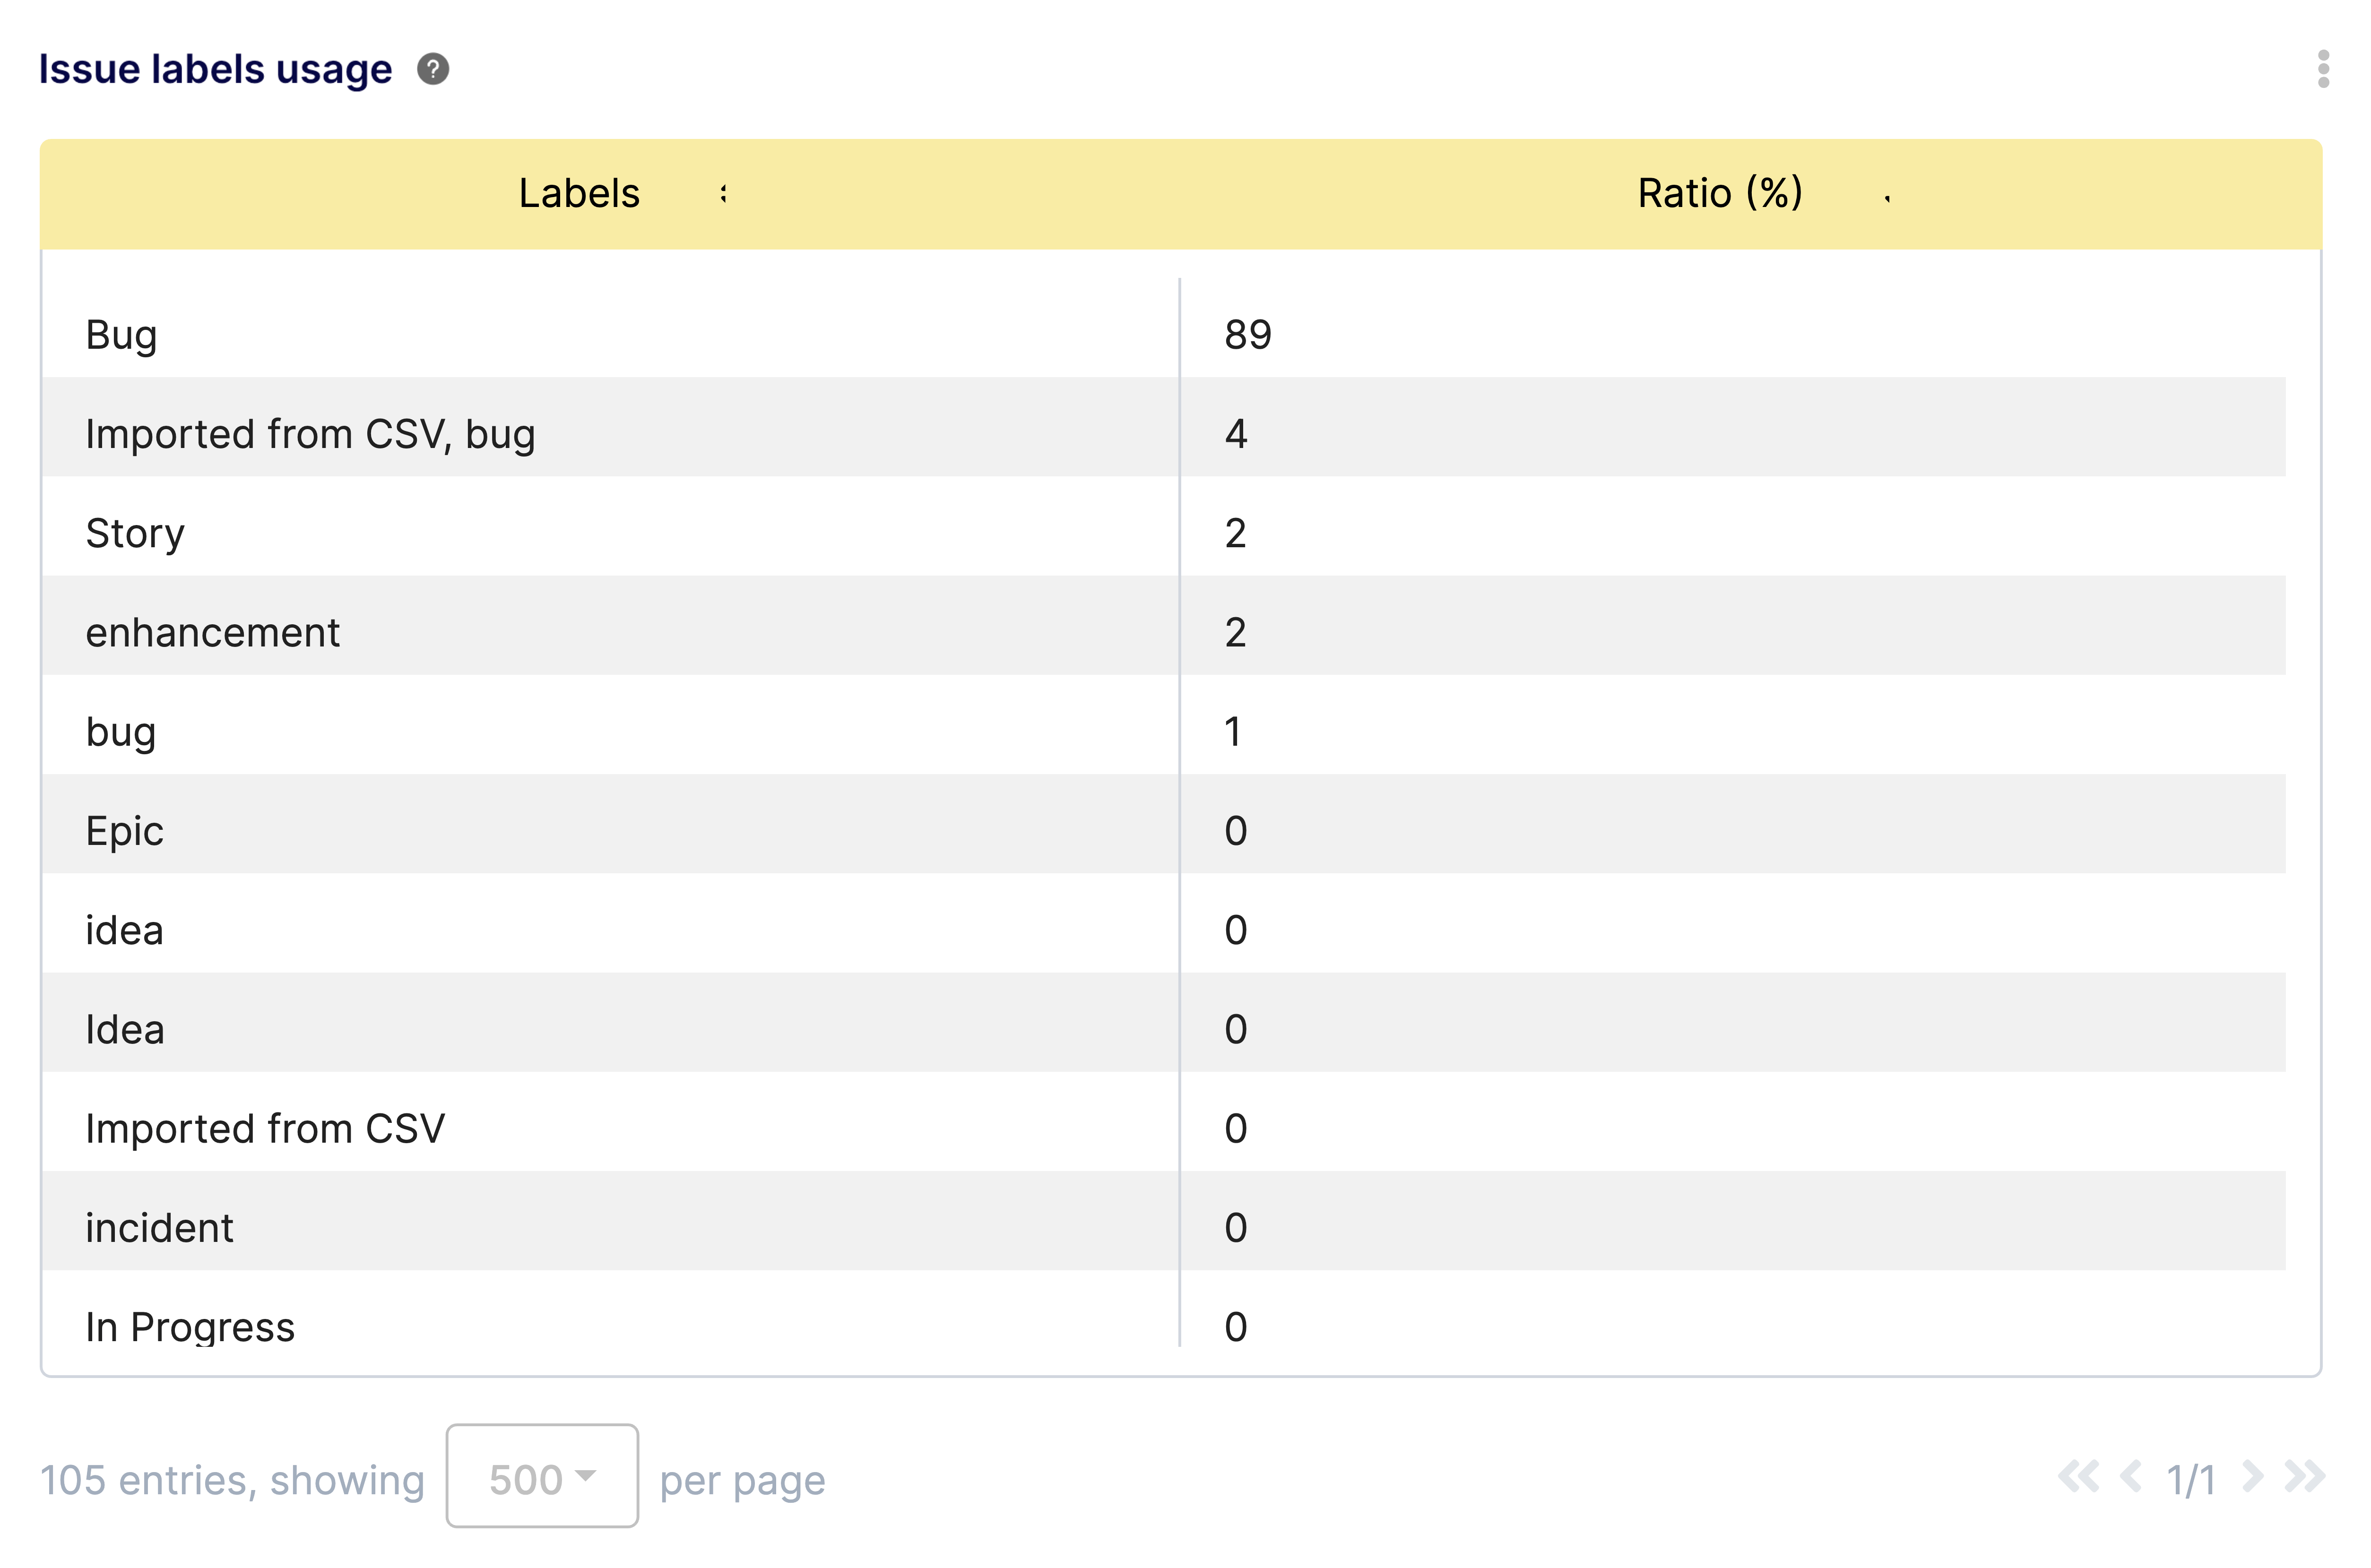
Understand the distribution of issue types by analyzing label usage across your projects.
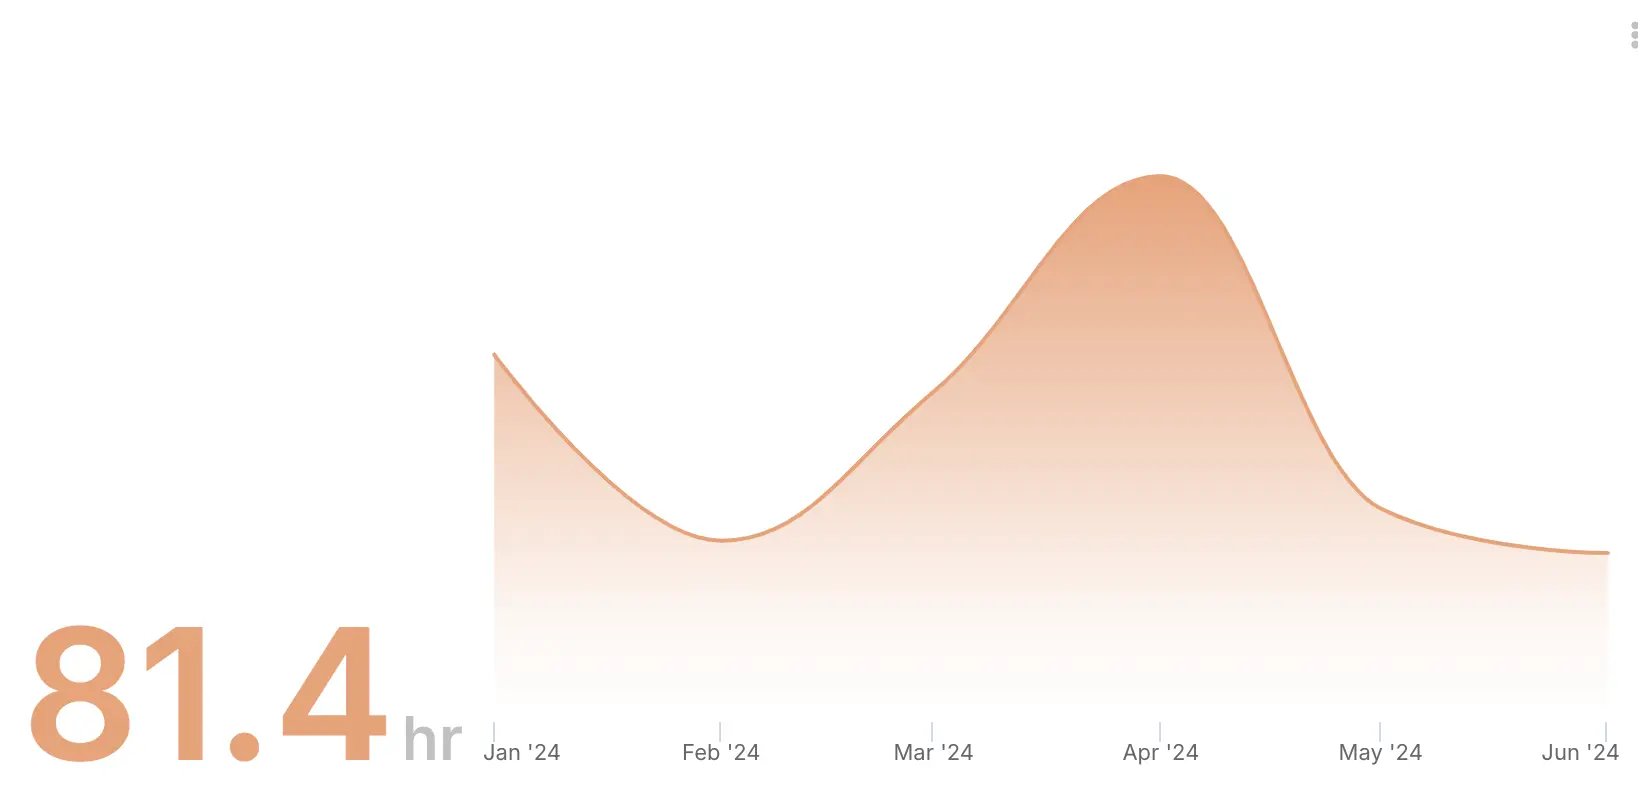
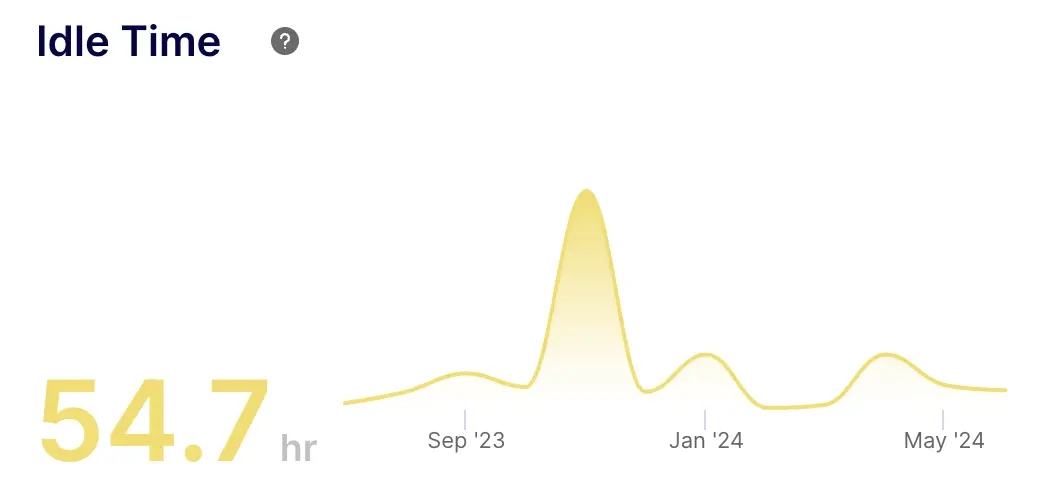
Track how long issues wait before work begins to improve responsiveness and assignment efficiency.
Monitor the duration issues spend in QA to optimize your testing and validation process.
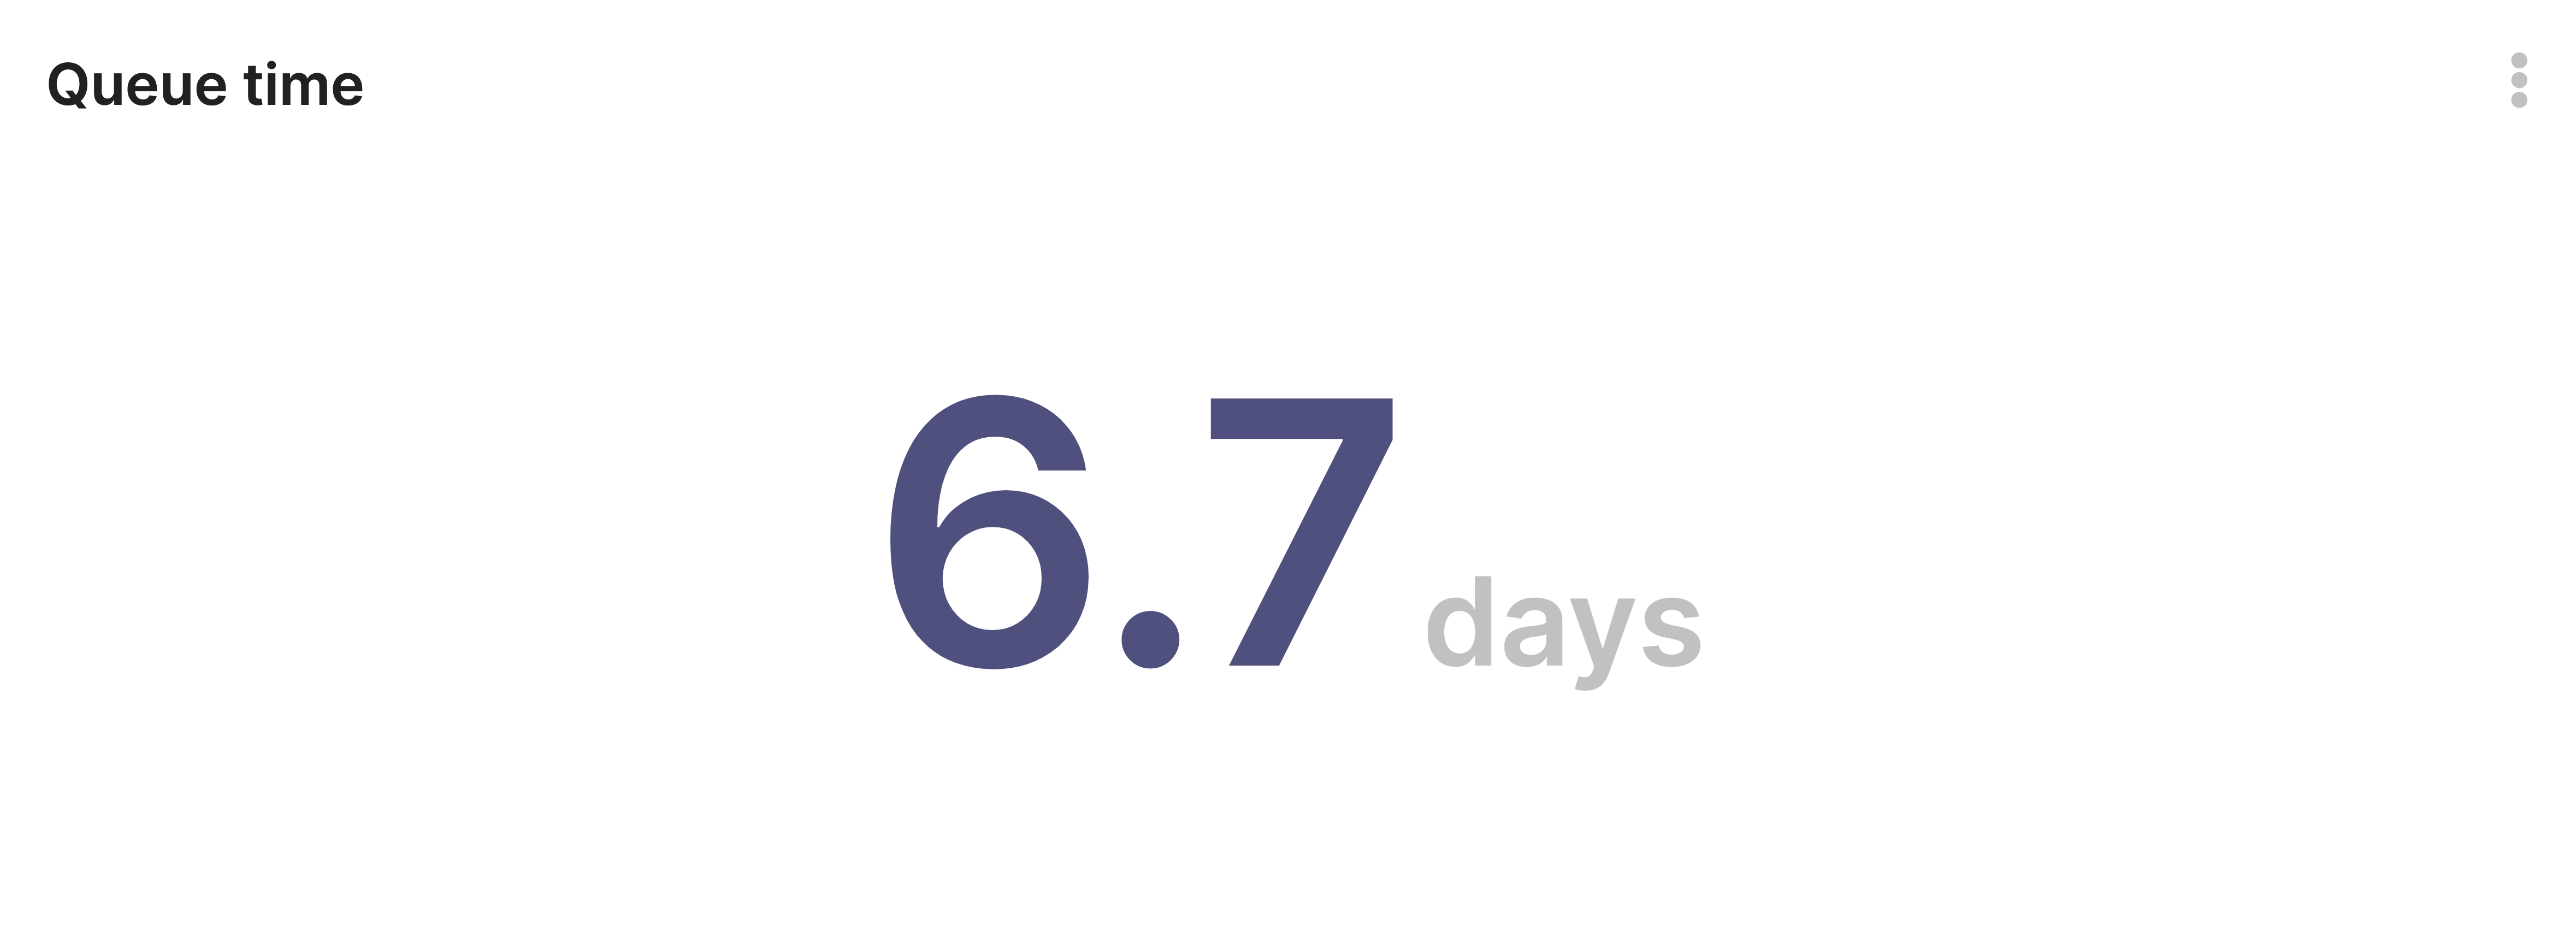
Measure the wait time between issue creation and assignment to reduce backlog stagnation.
Track the time from code completion to deployment to streamline your release pipeline.
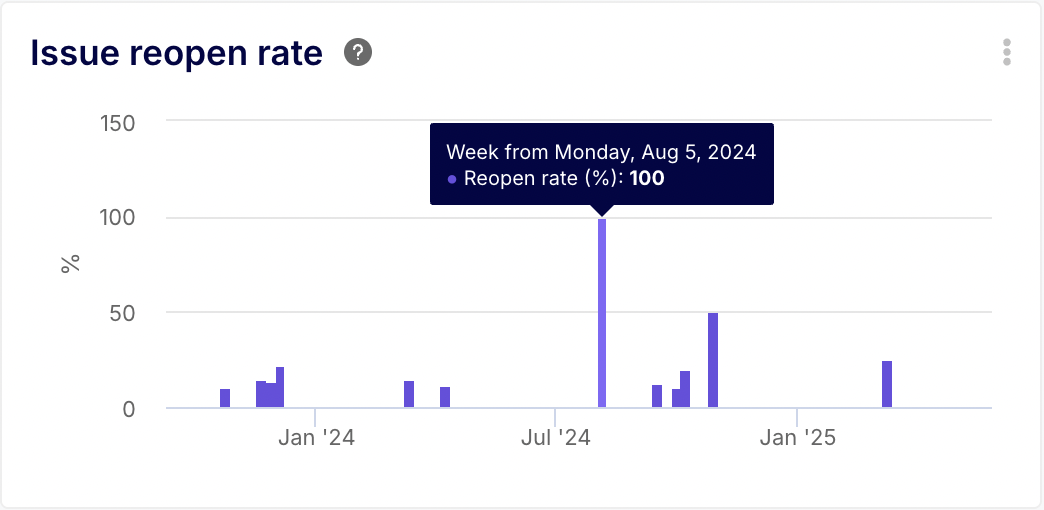
Monitor how often closed issues are reopened to assess quality control and fix effectiveness.
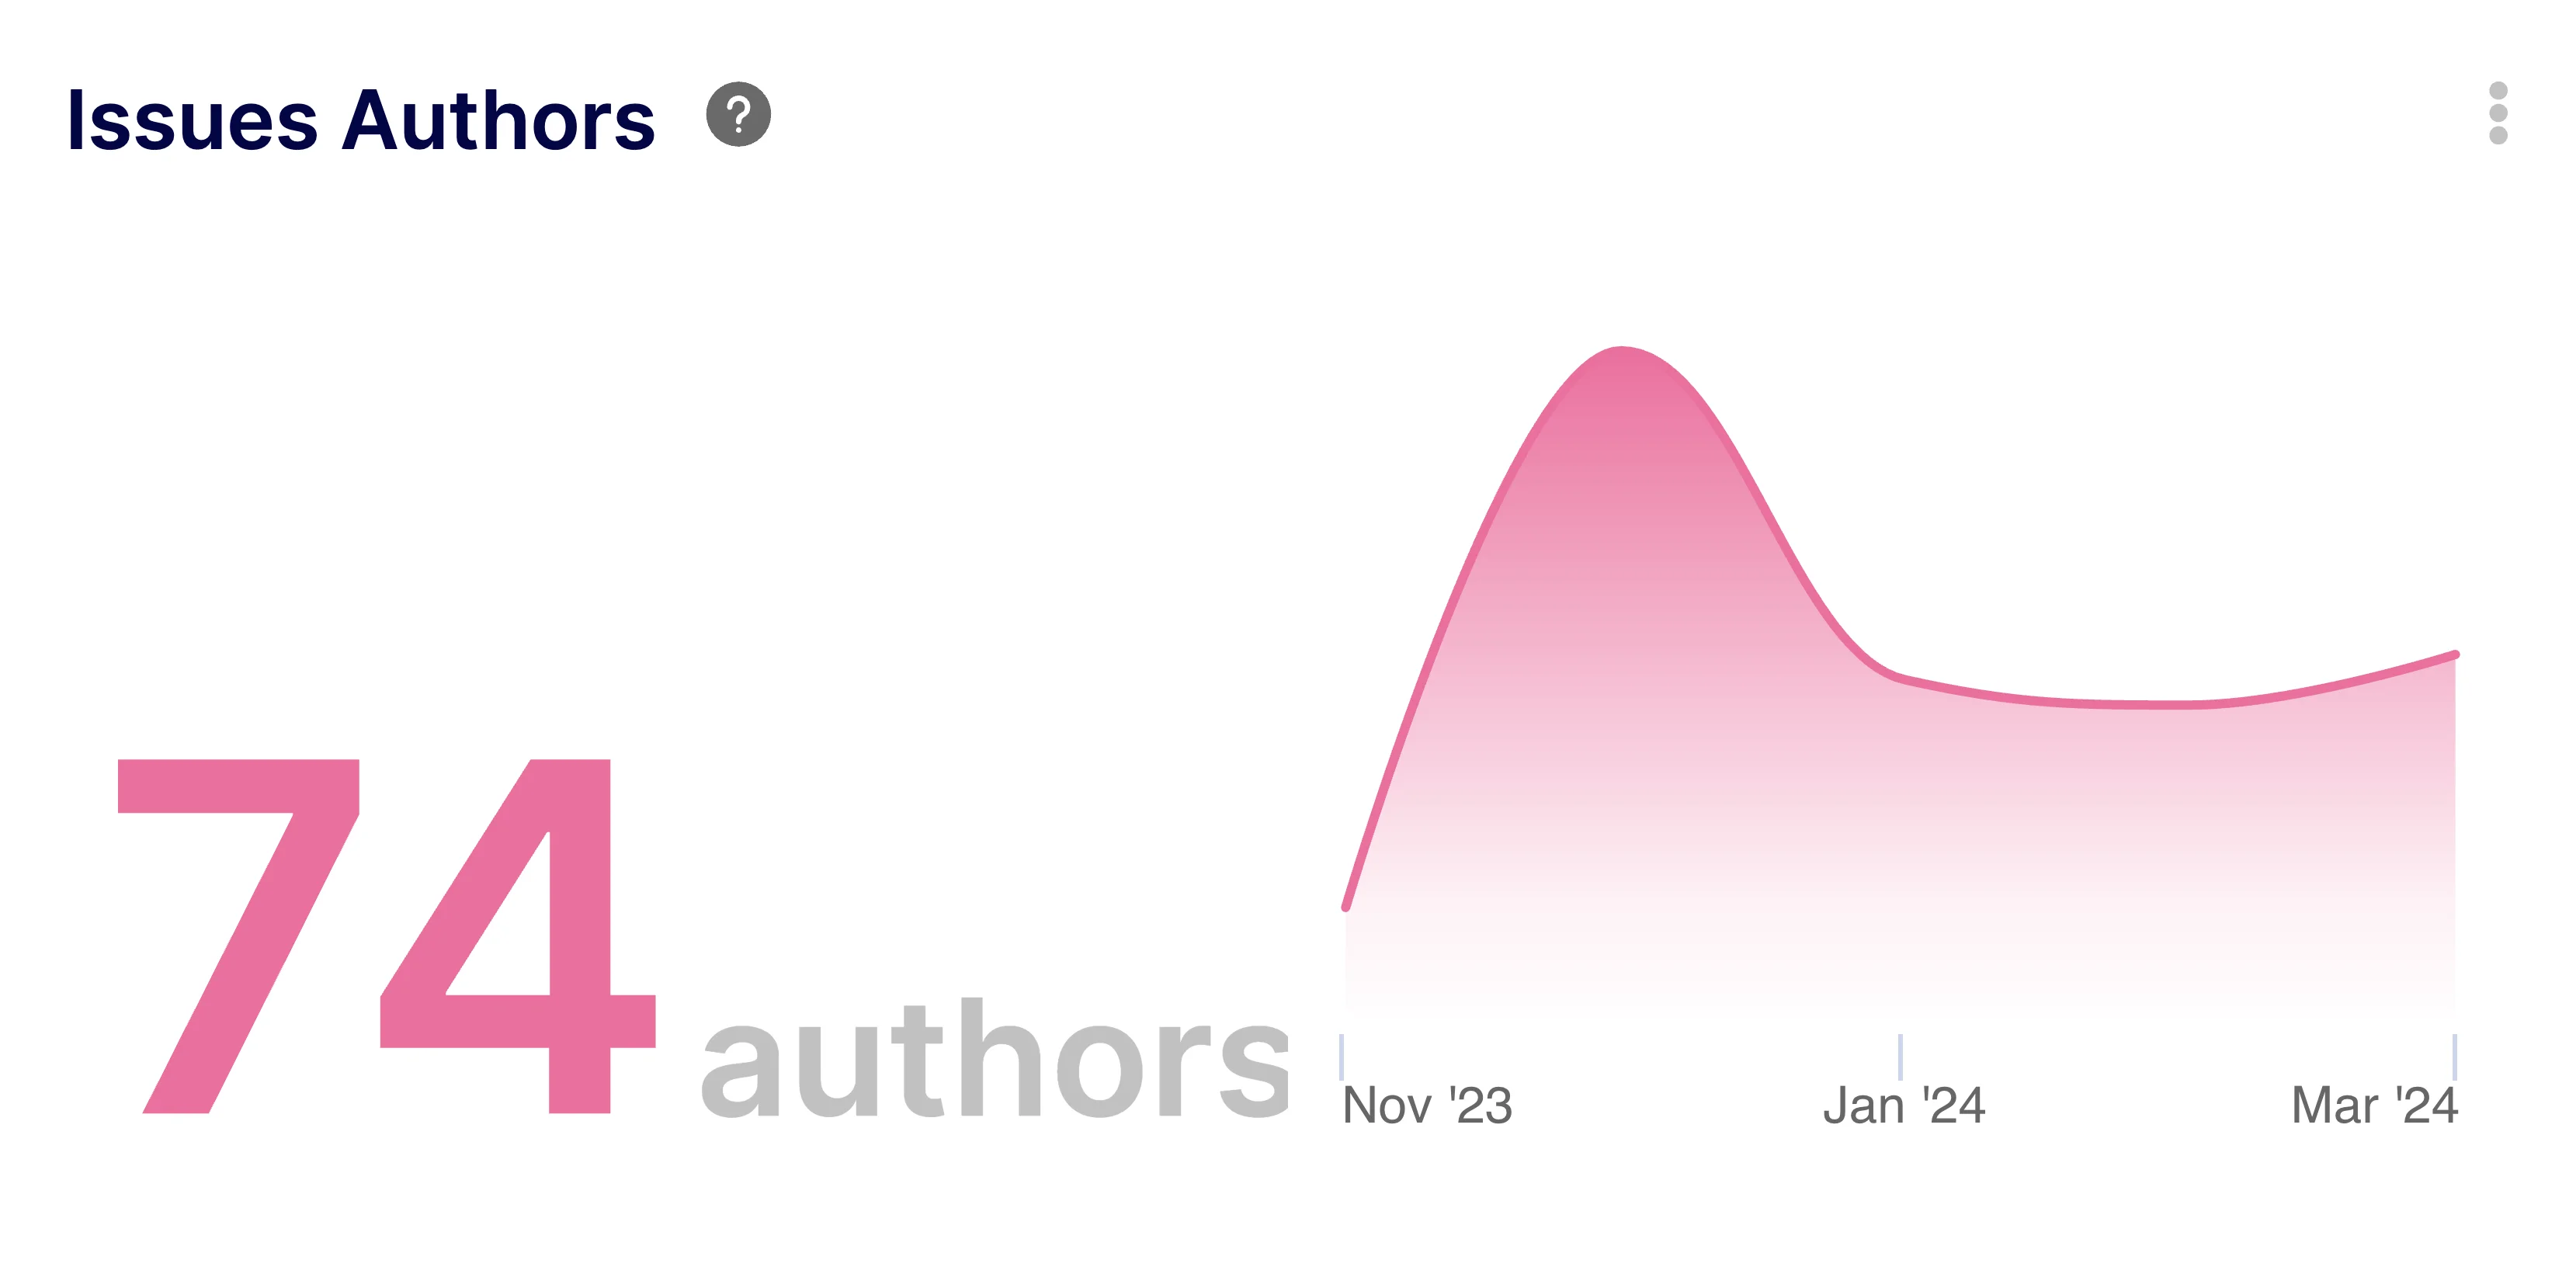
Analyze who is reporting issues to understand team engagement and project stakeholder involvement.
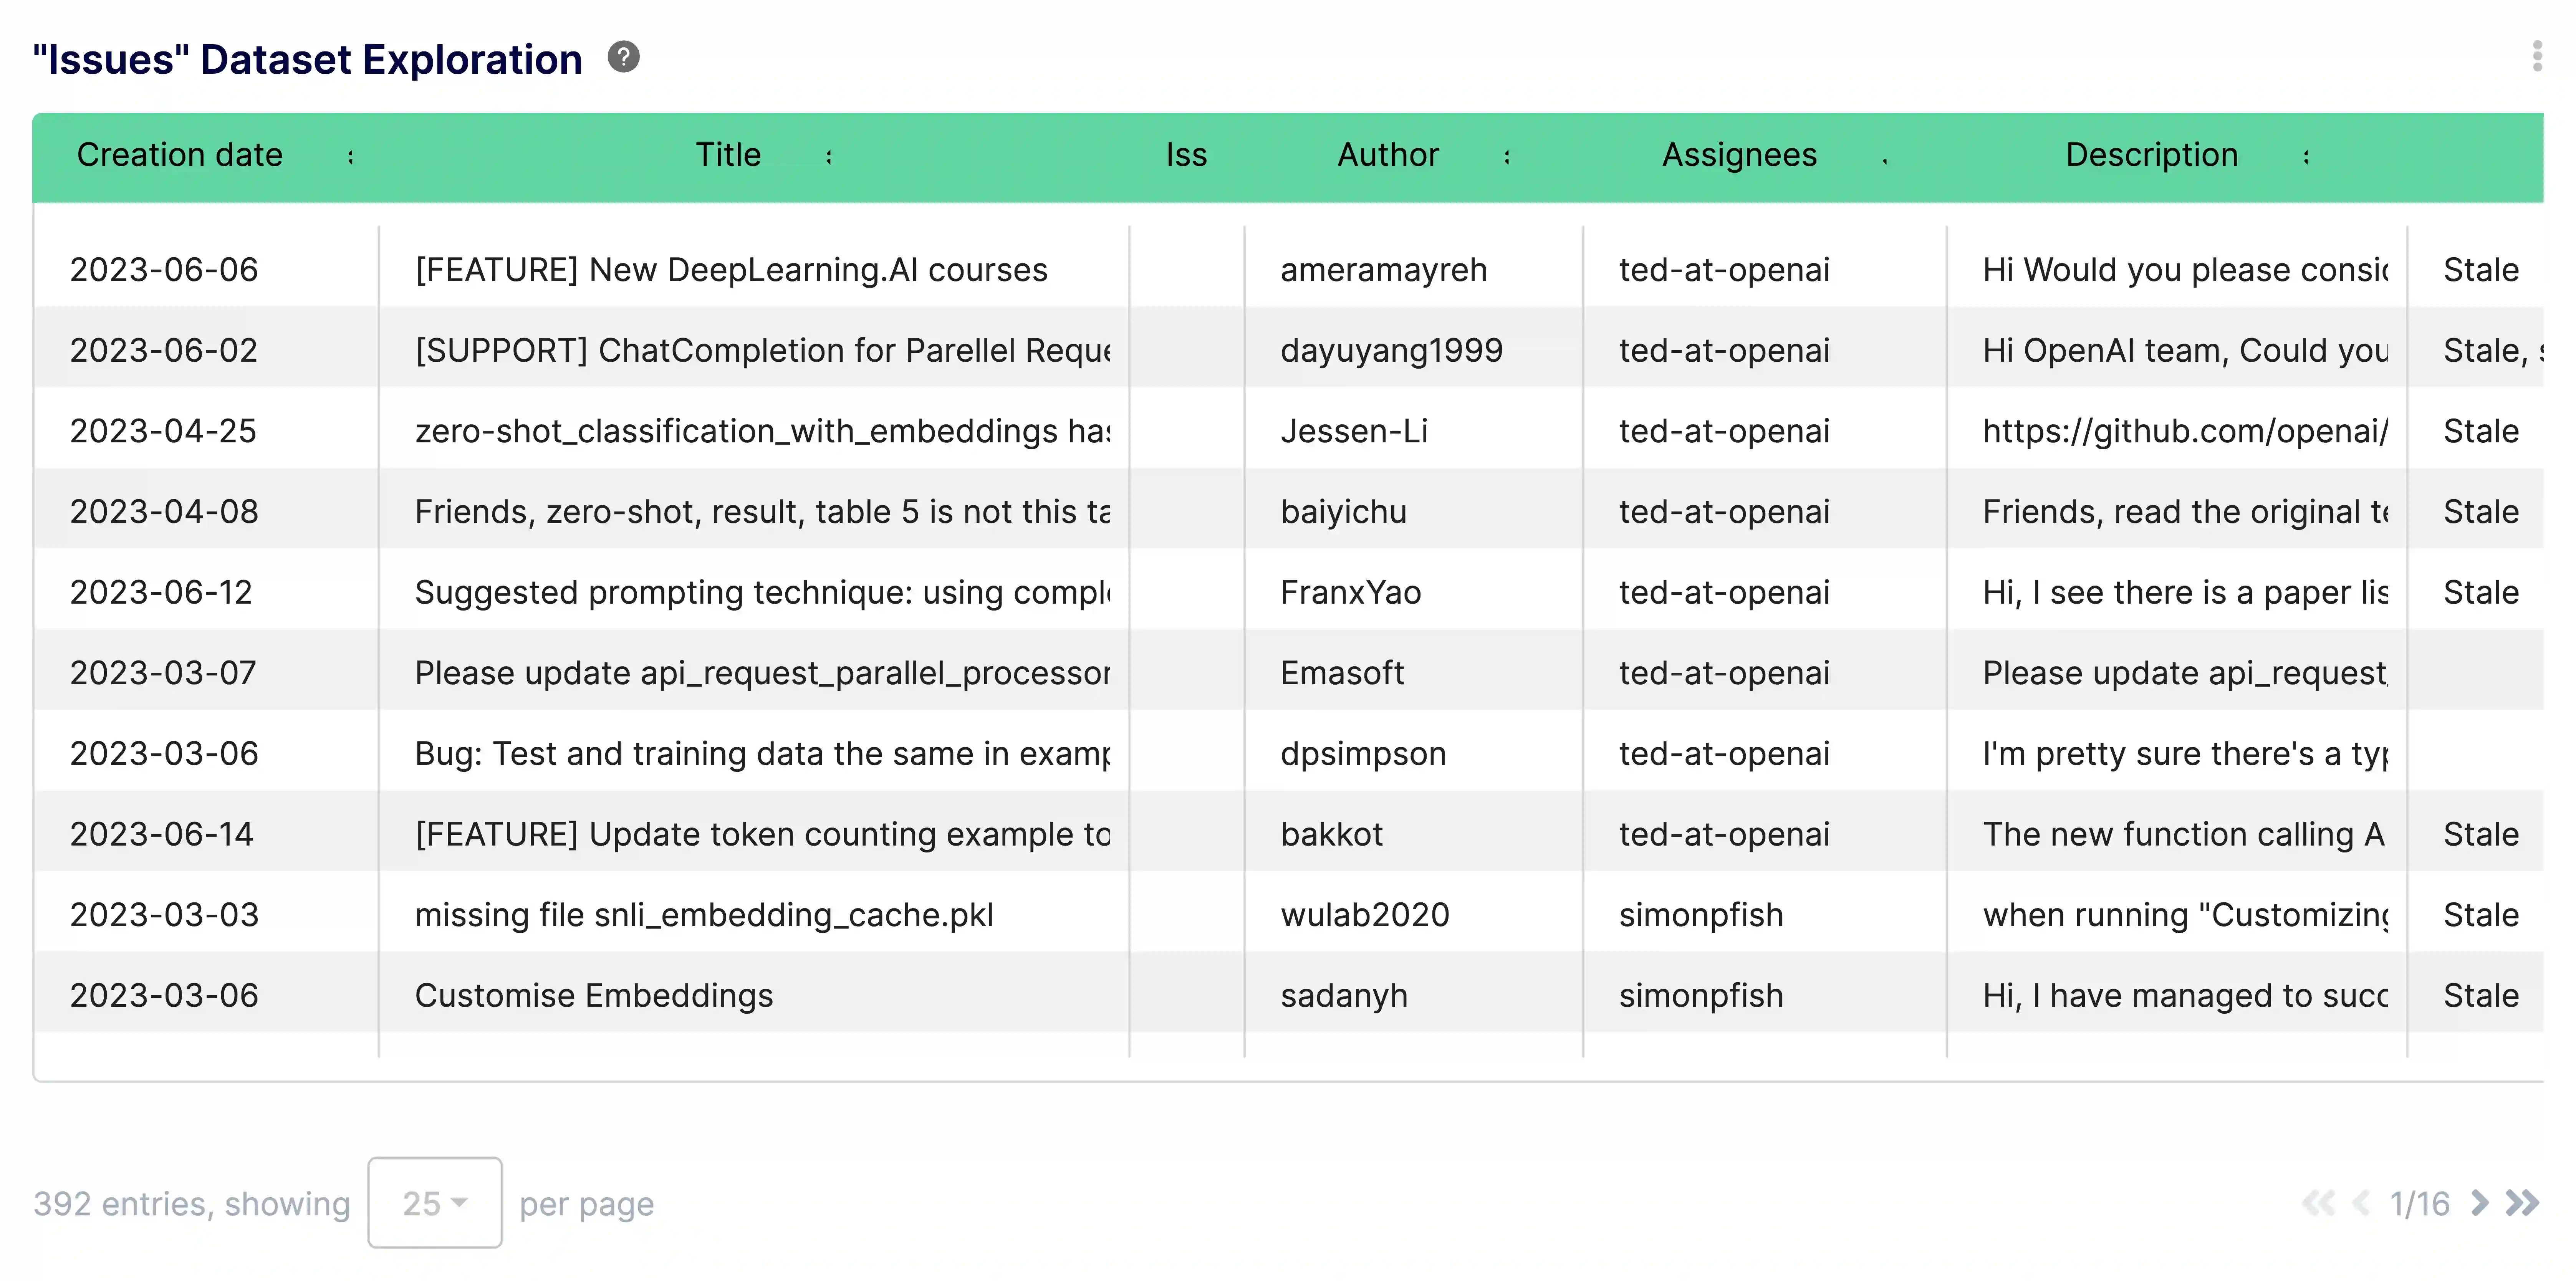
Access raw issue data to create custom reports on backlog health and resolution trends.
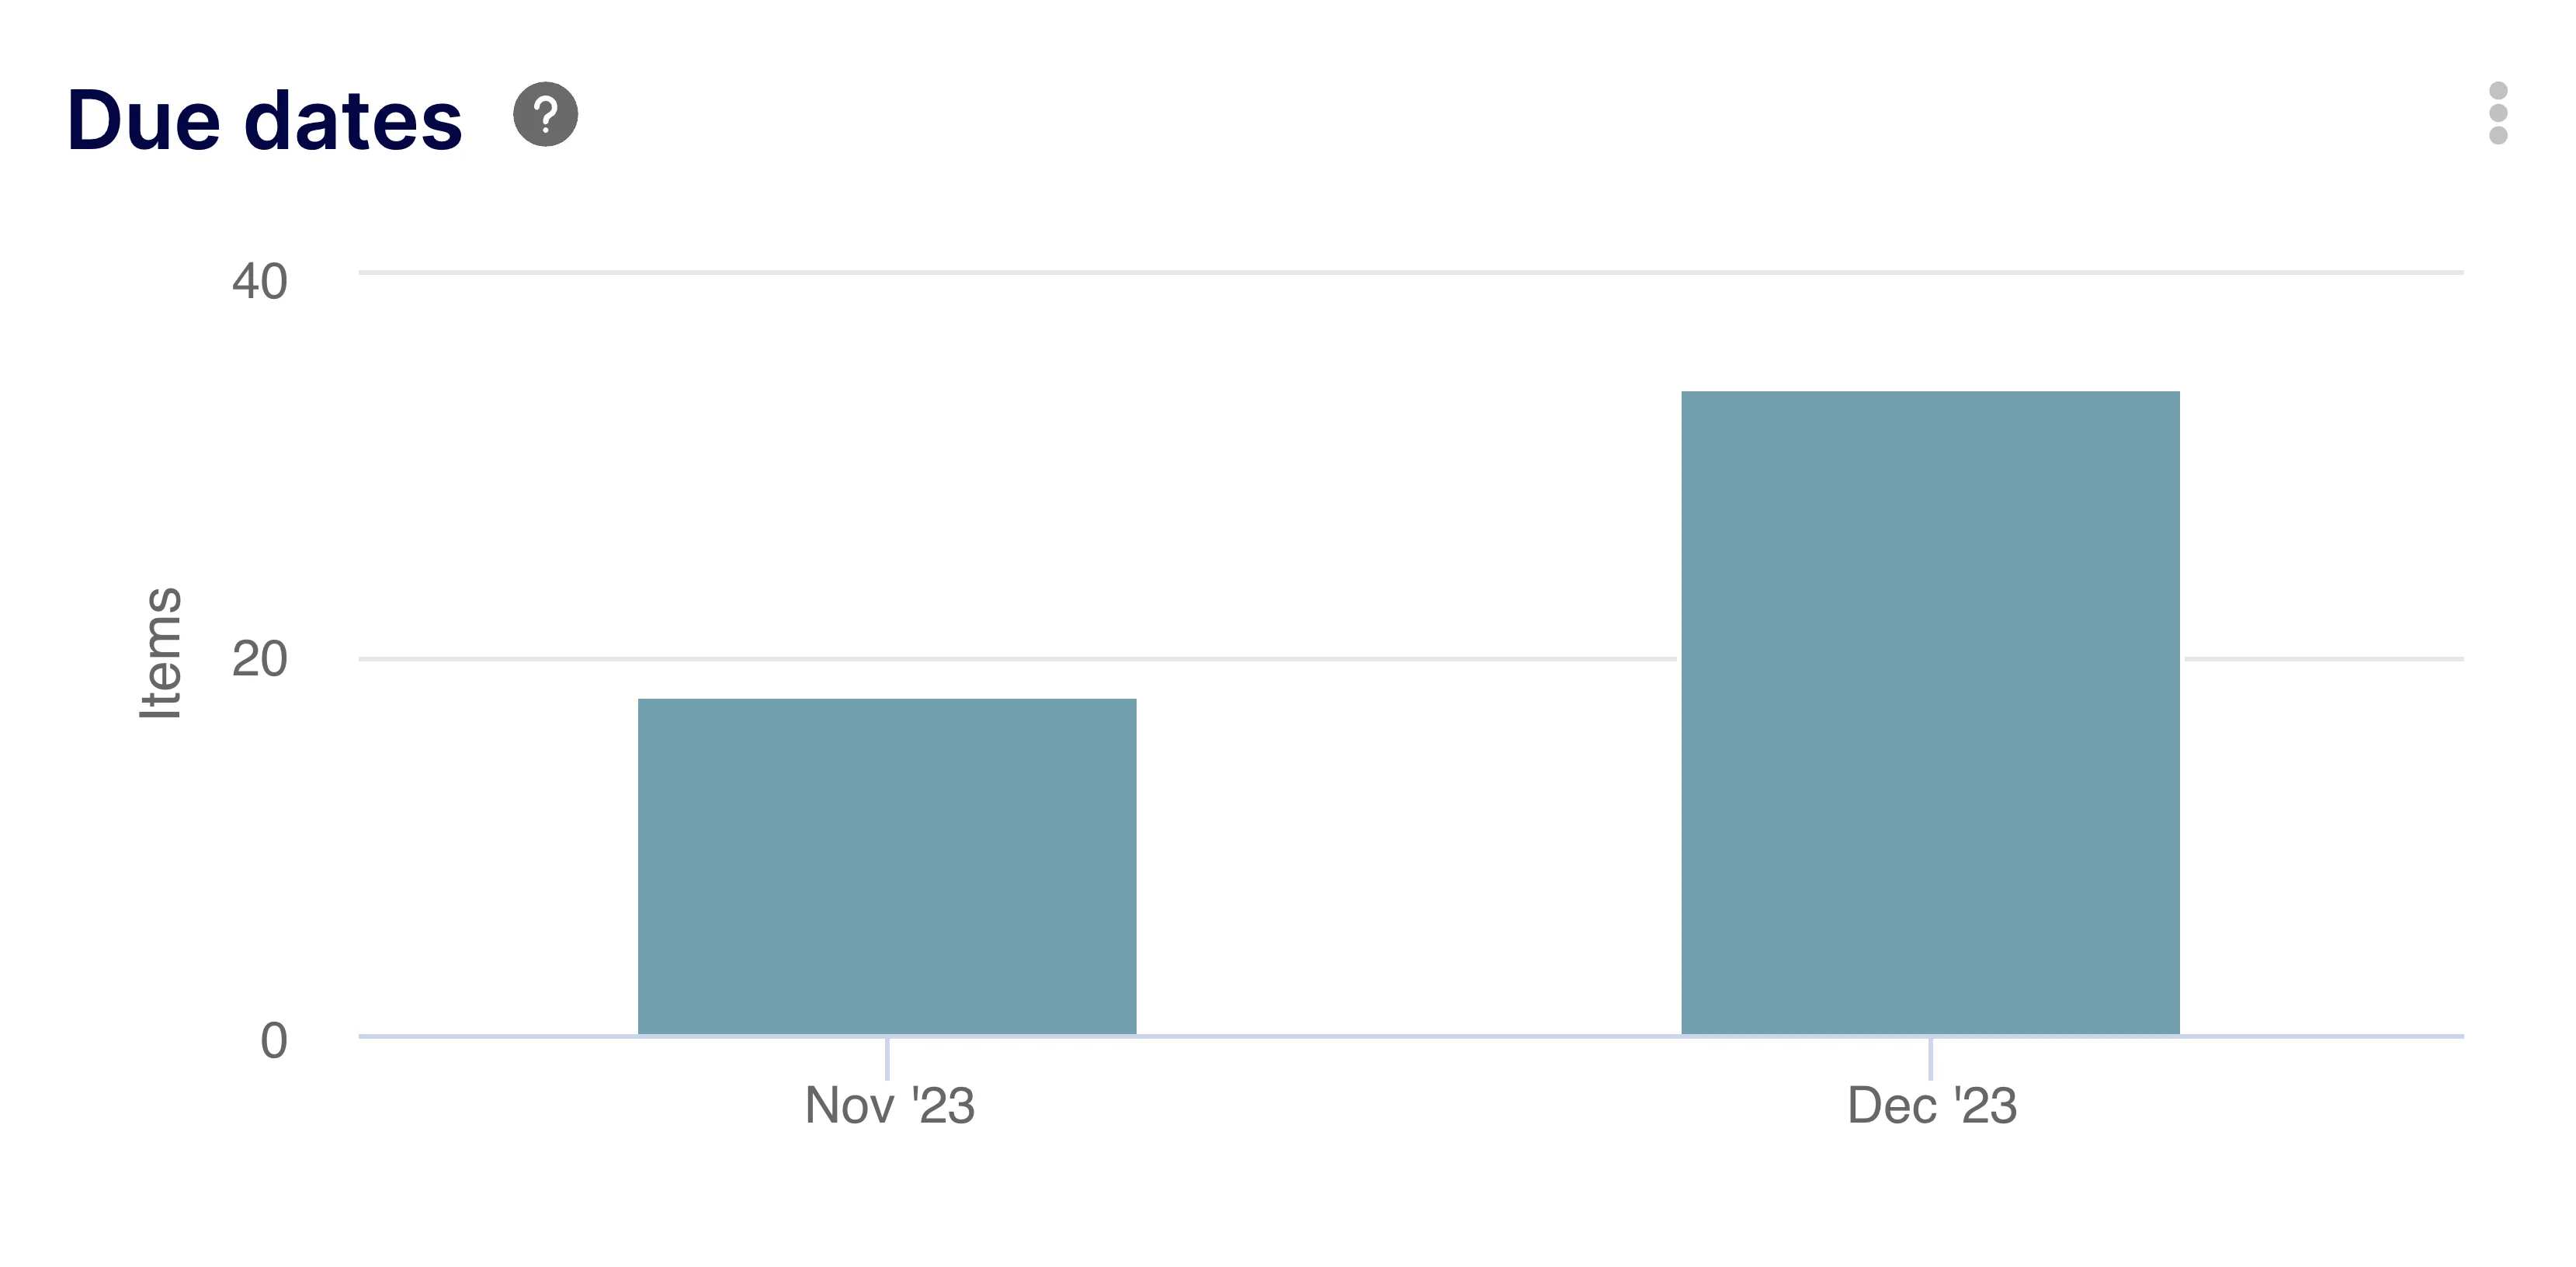
Get an overview of upcoming deadlines for all issues and pull requests to ensure timely delivery.
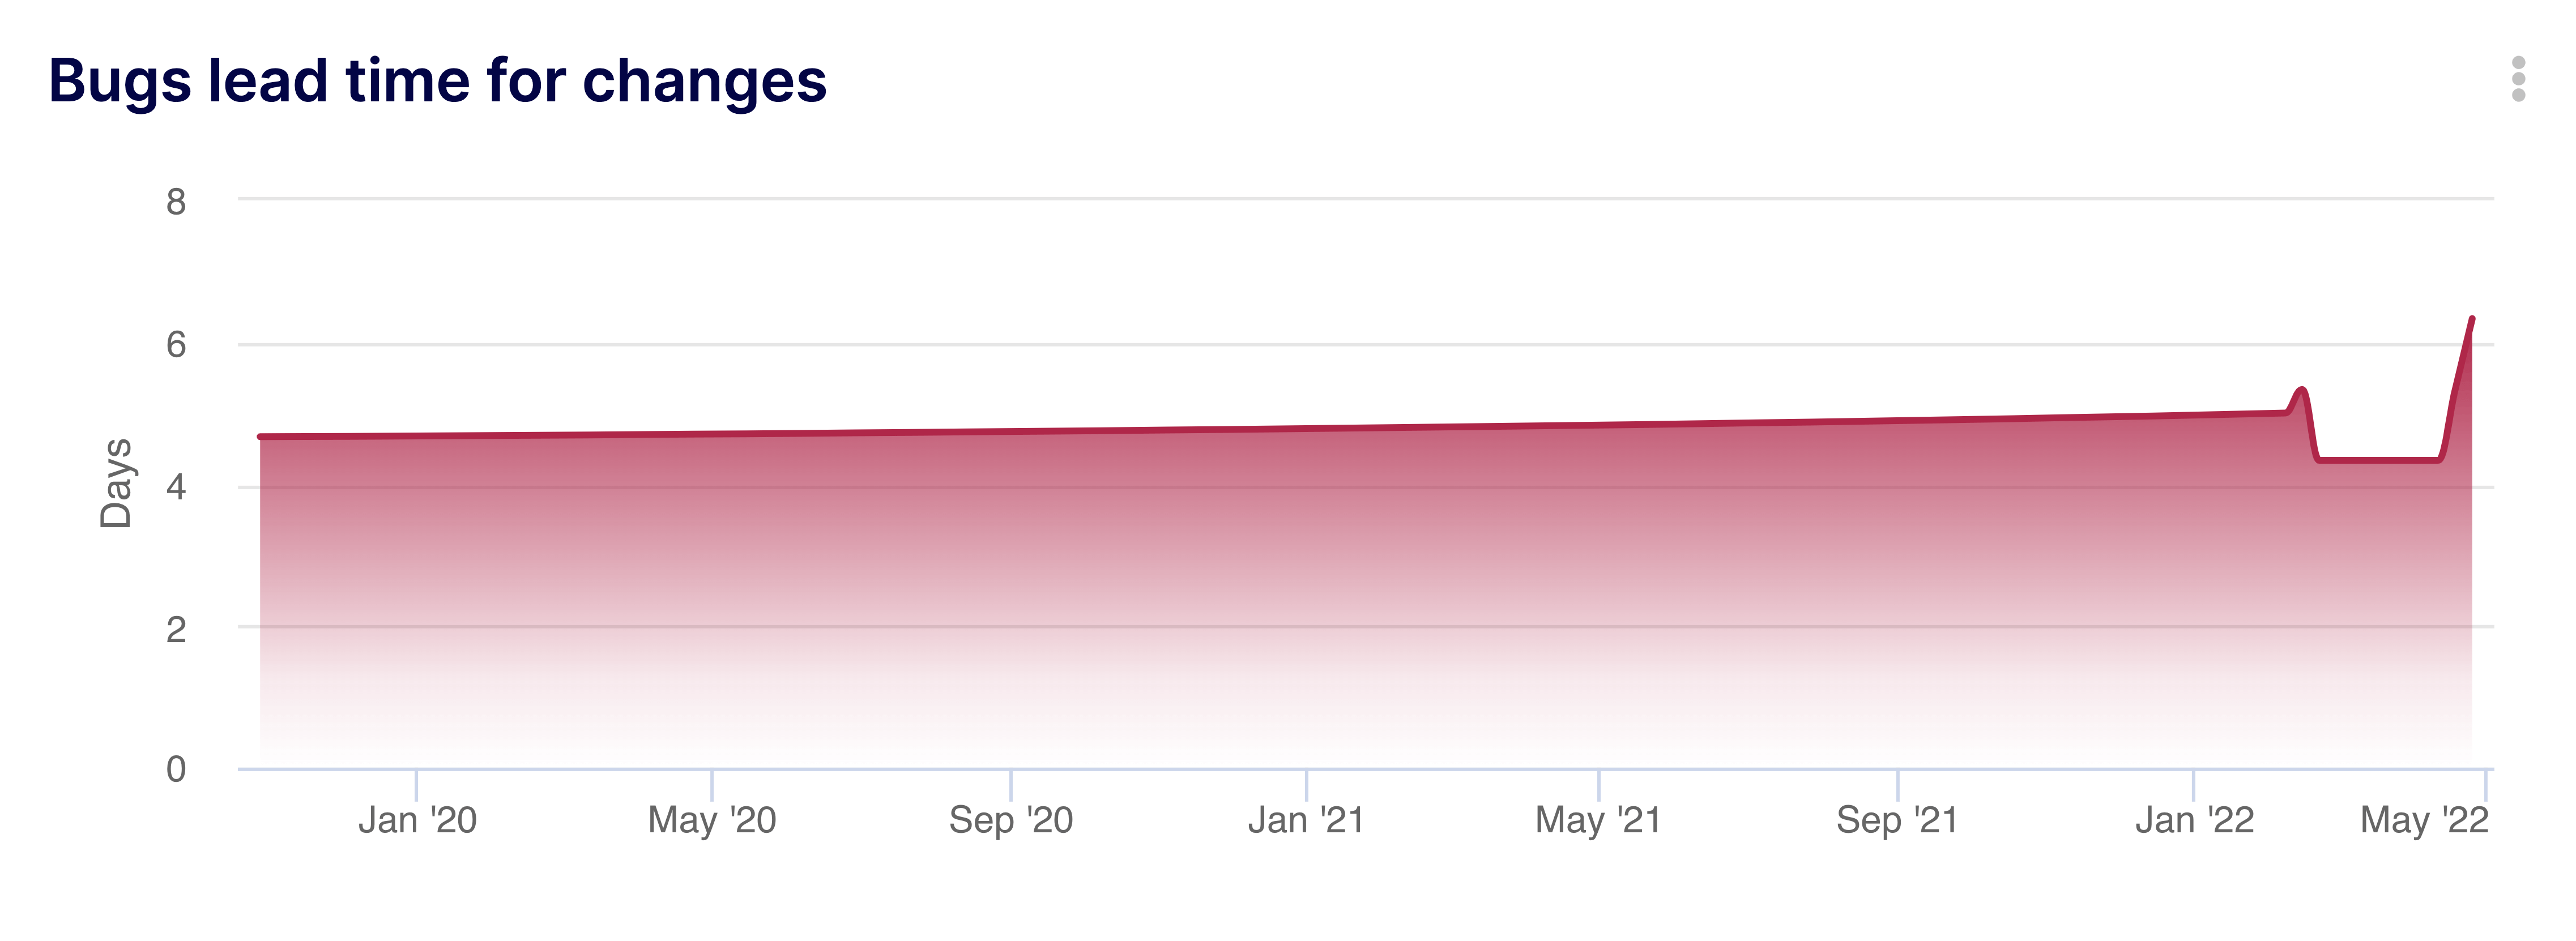
Track the time it takes to fix bugs from discovery to resolution to improve system stability.
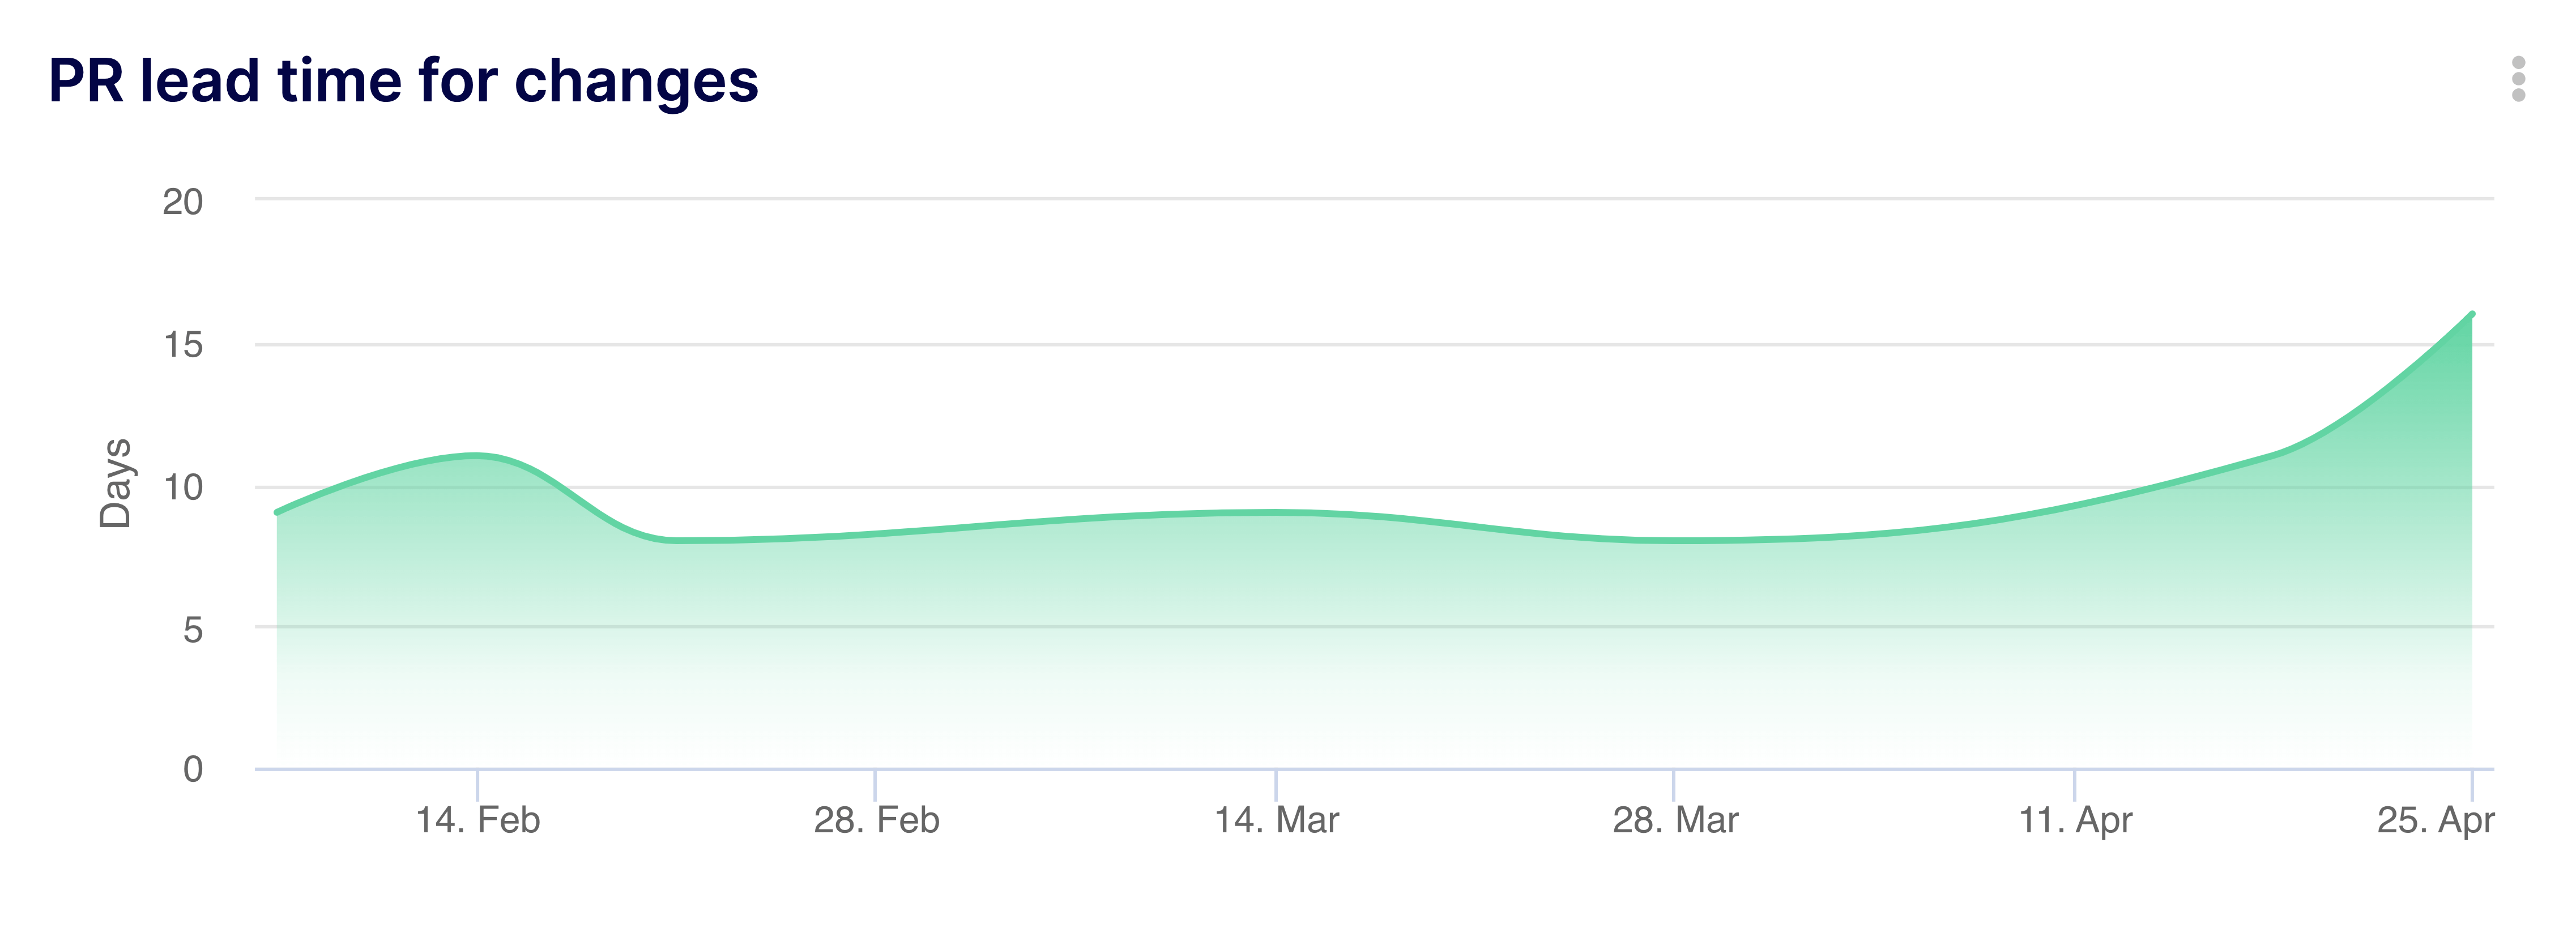
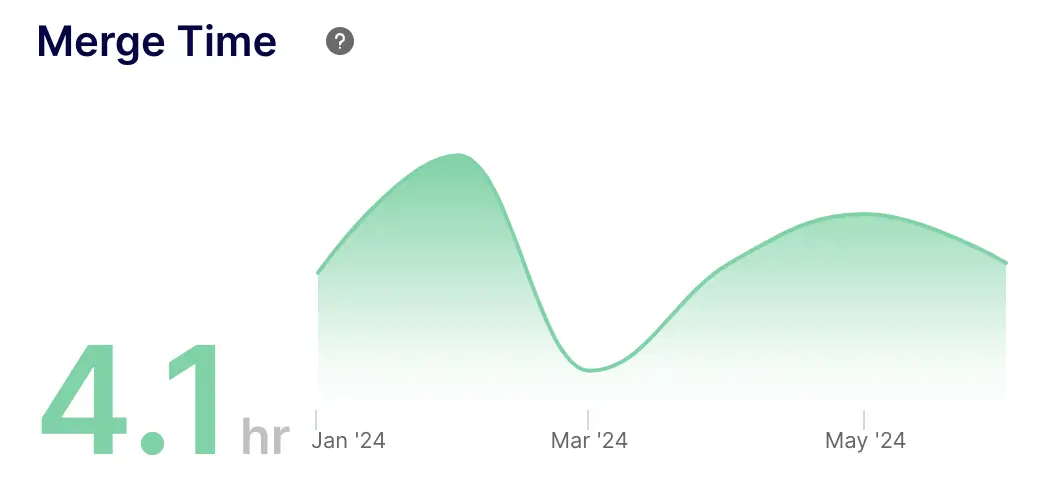
Measure code delivery speed by tracking the time from PR creation to merge.
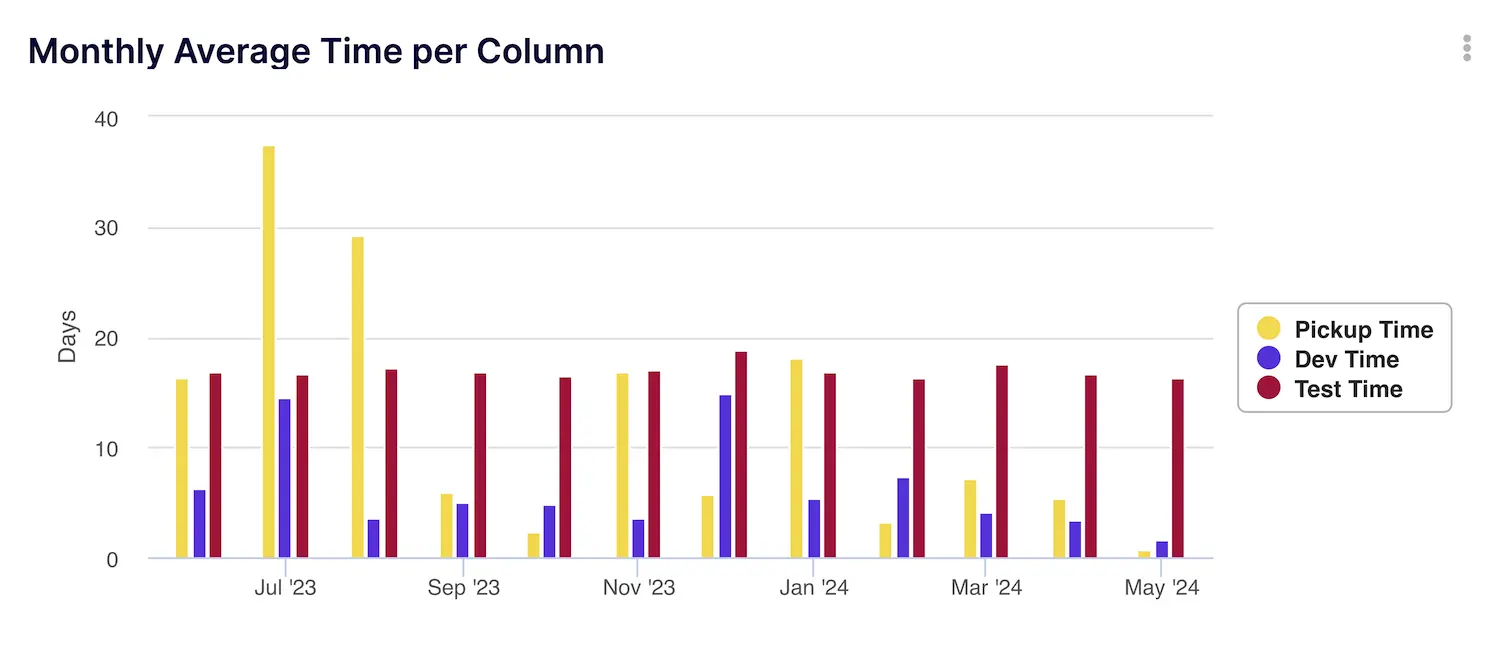
Analyze how long items sit in each workflow stage monthly to identify persistent bottlenecks.
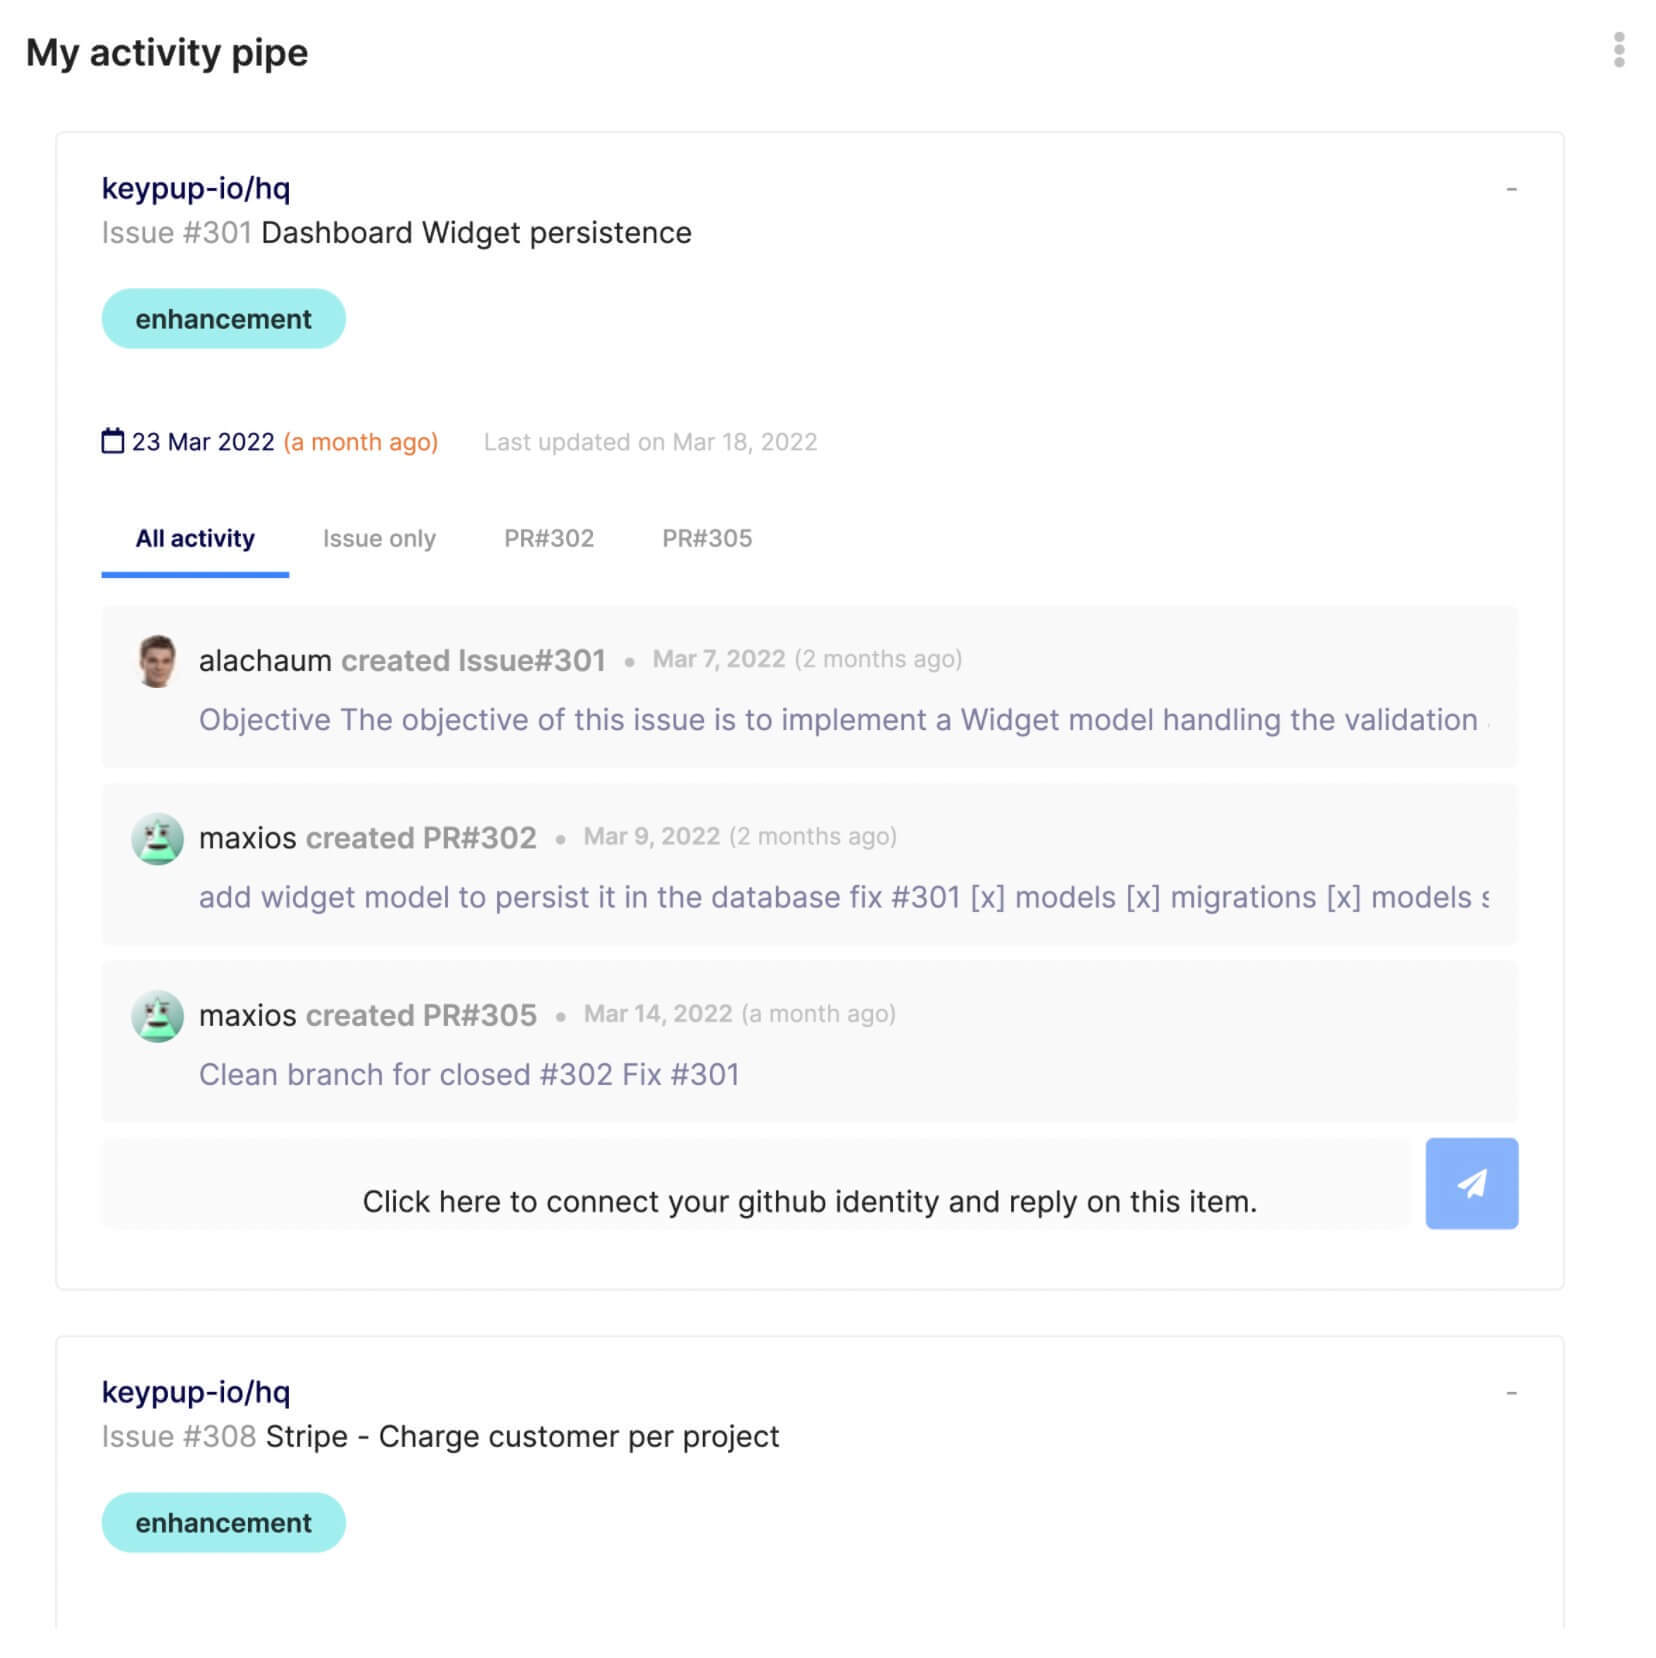
View all your active pull requests and issues in one place to prioritize your daily work.
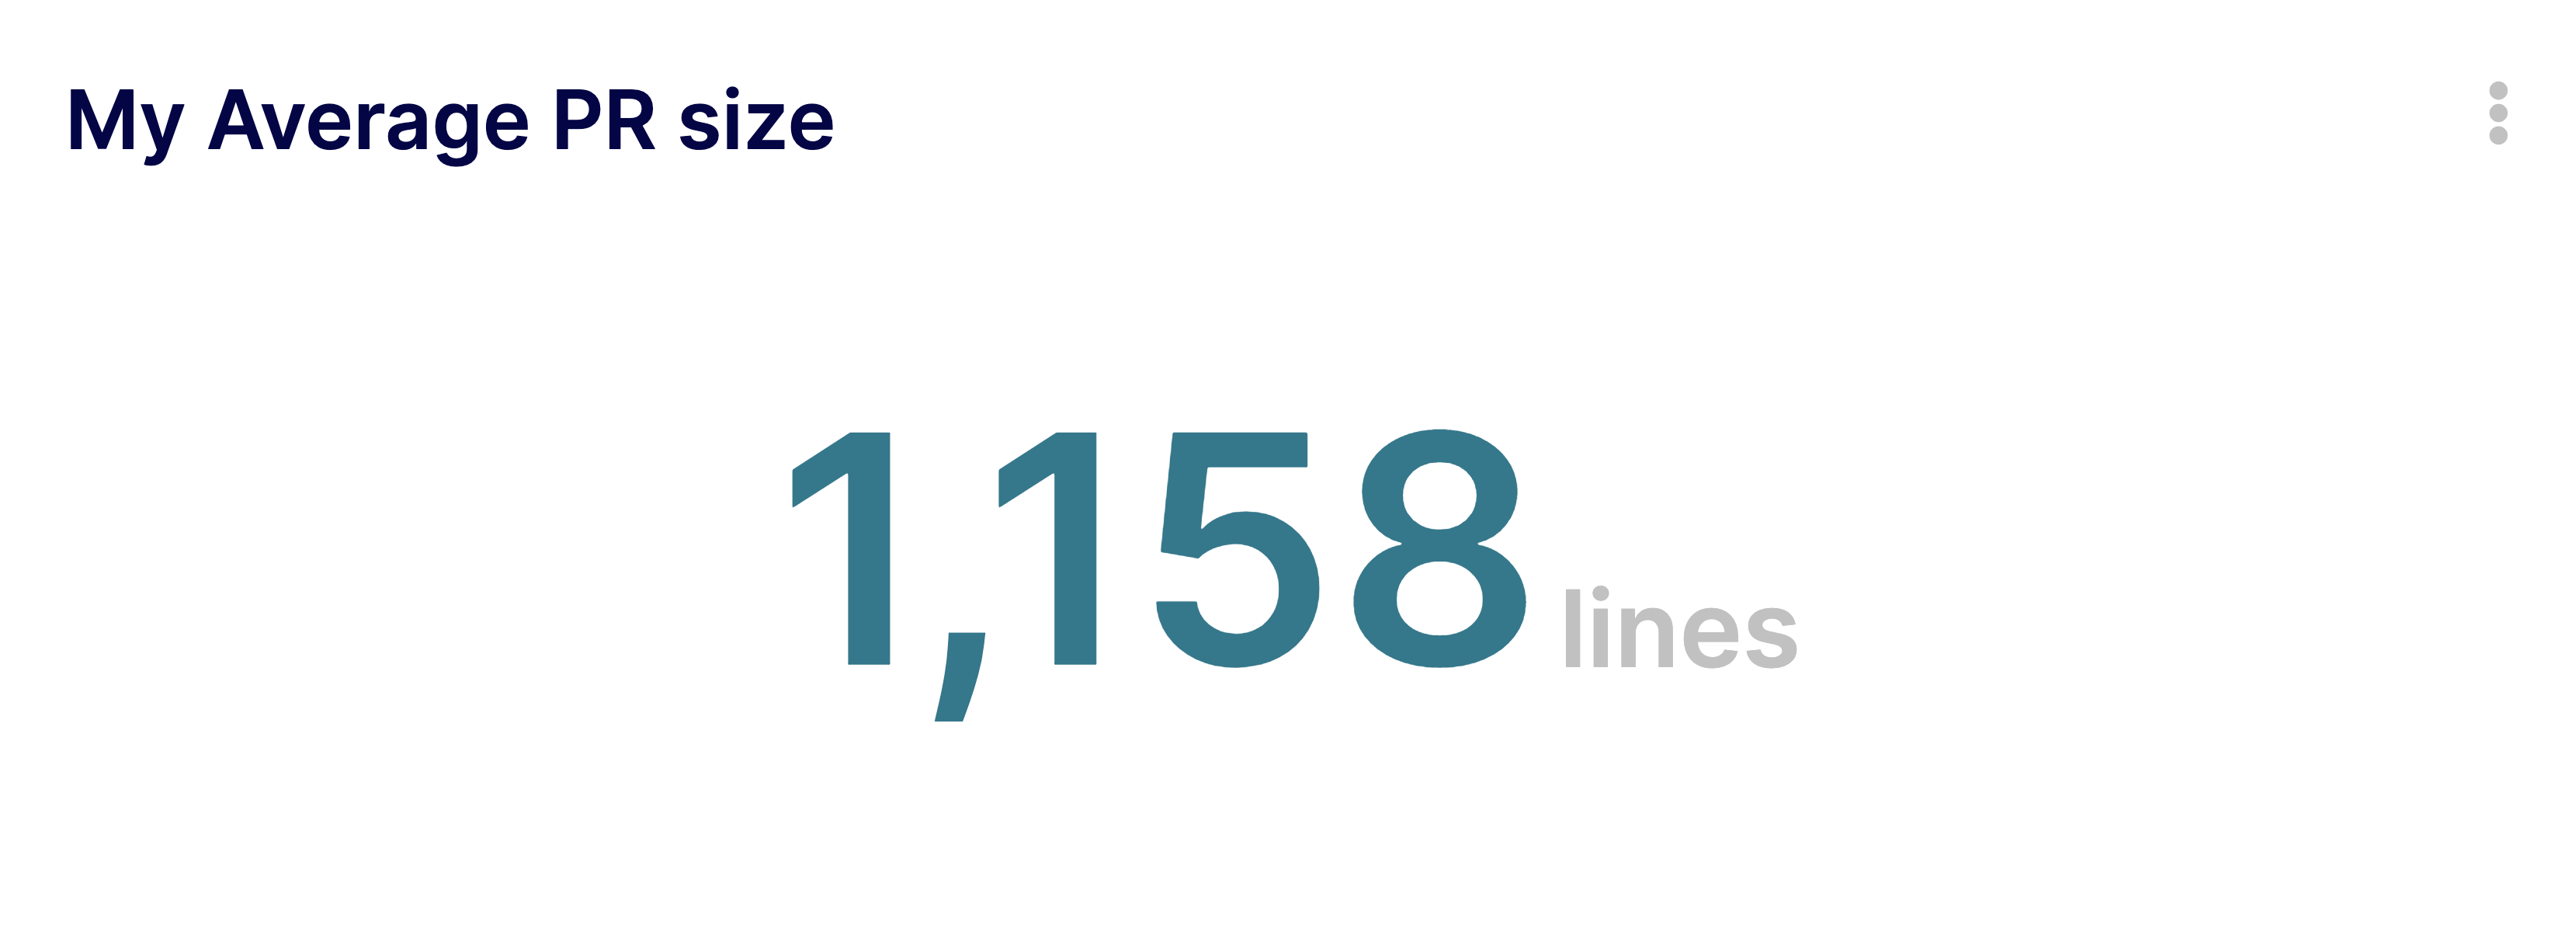
Track your personal average PR size to ensure you are contributing manageable code chunks.
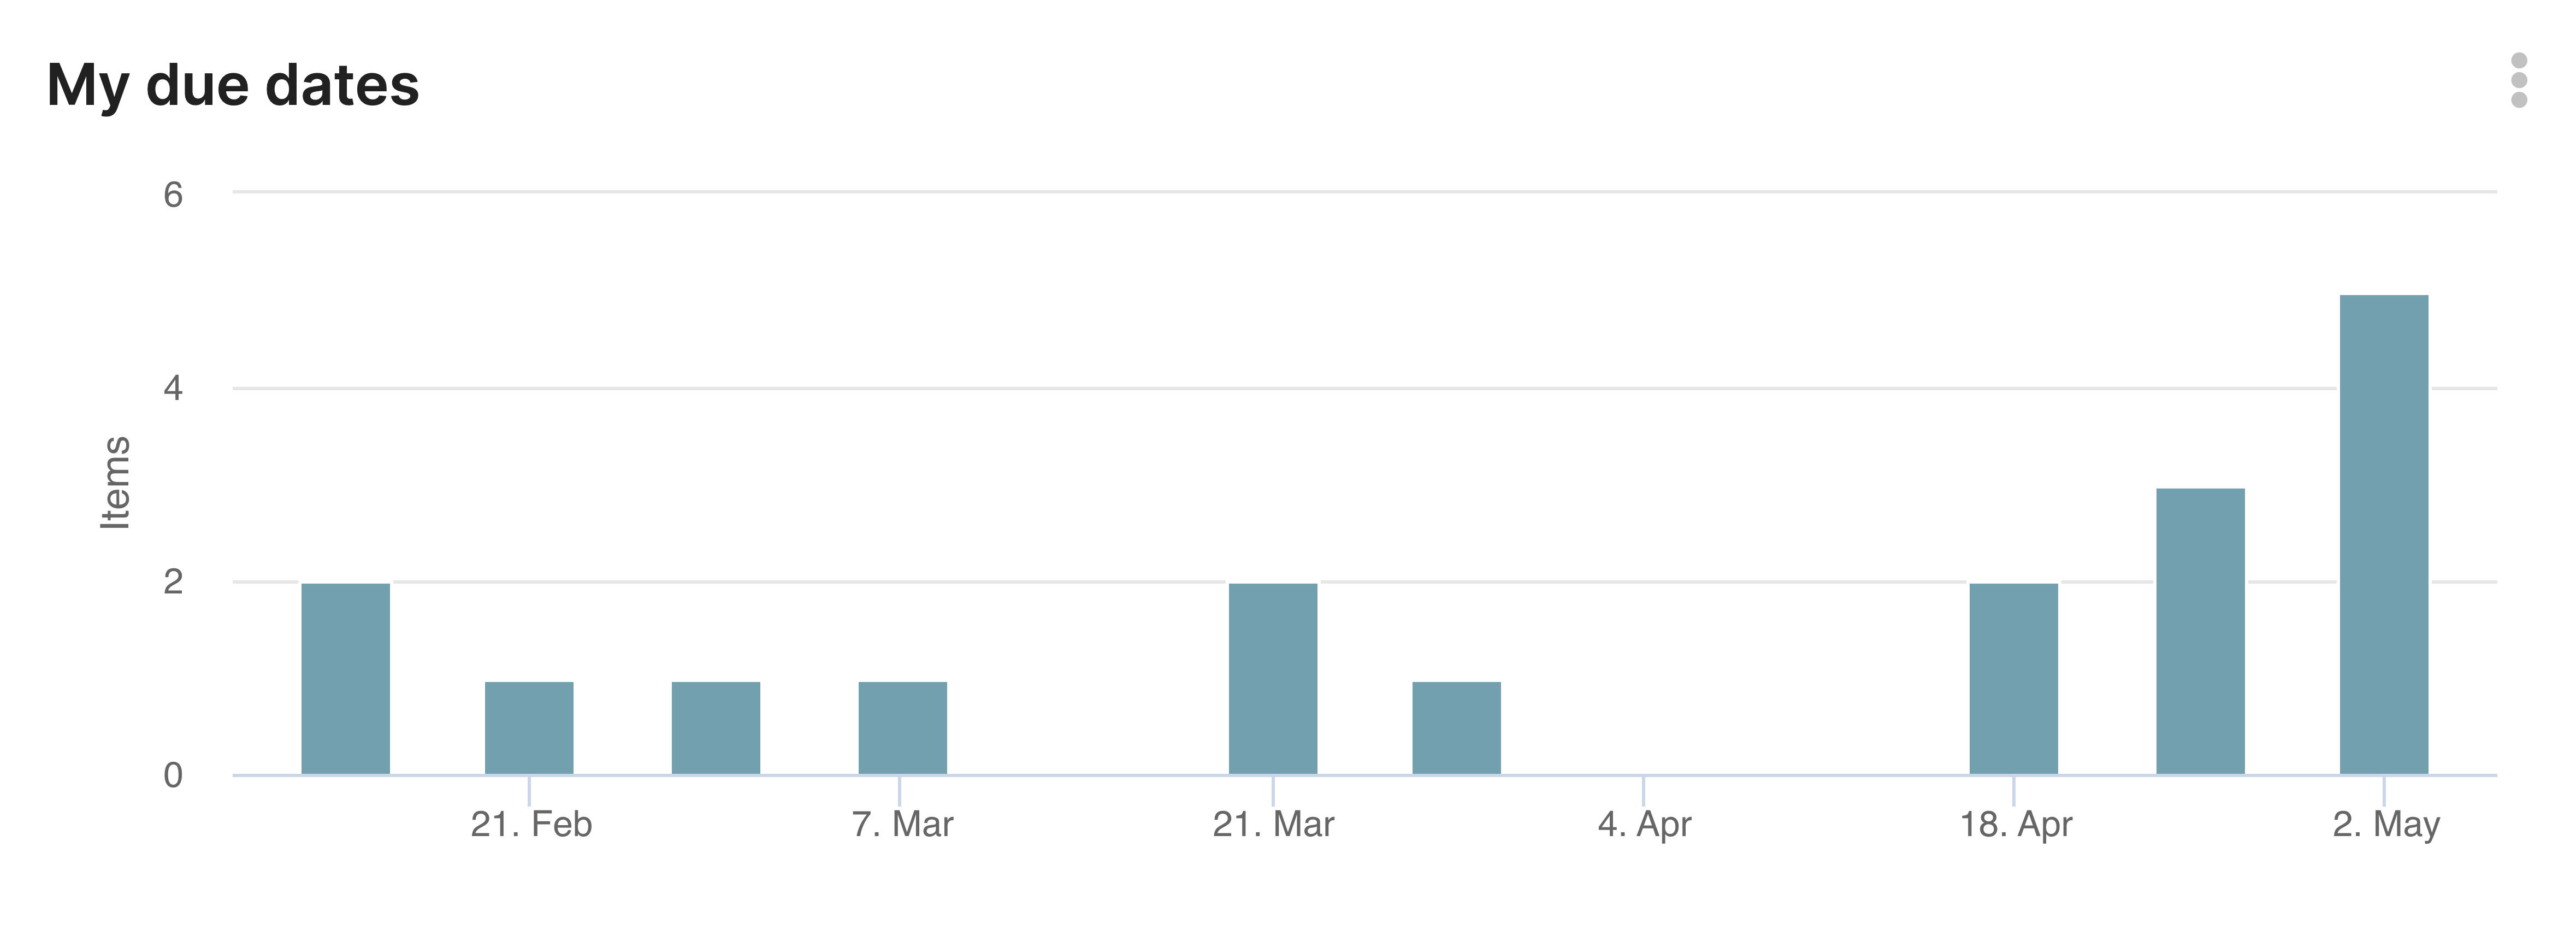
Stay on top of your deadlines by viewing all your assigned tasks organized by due date.
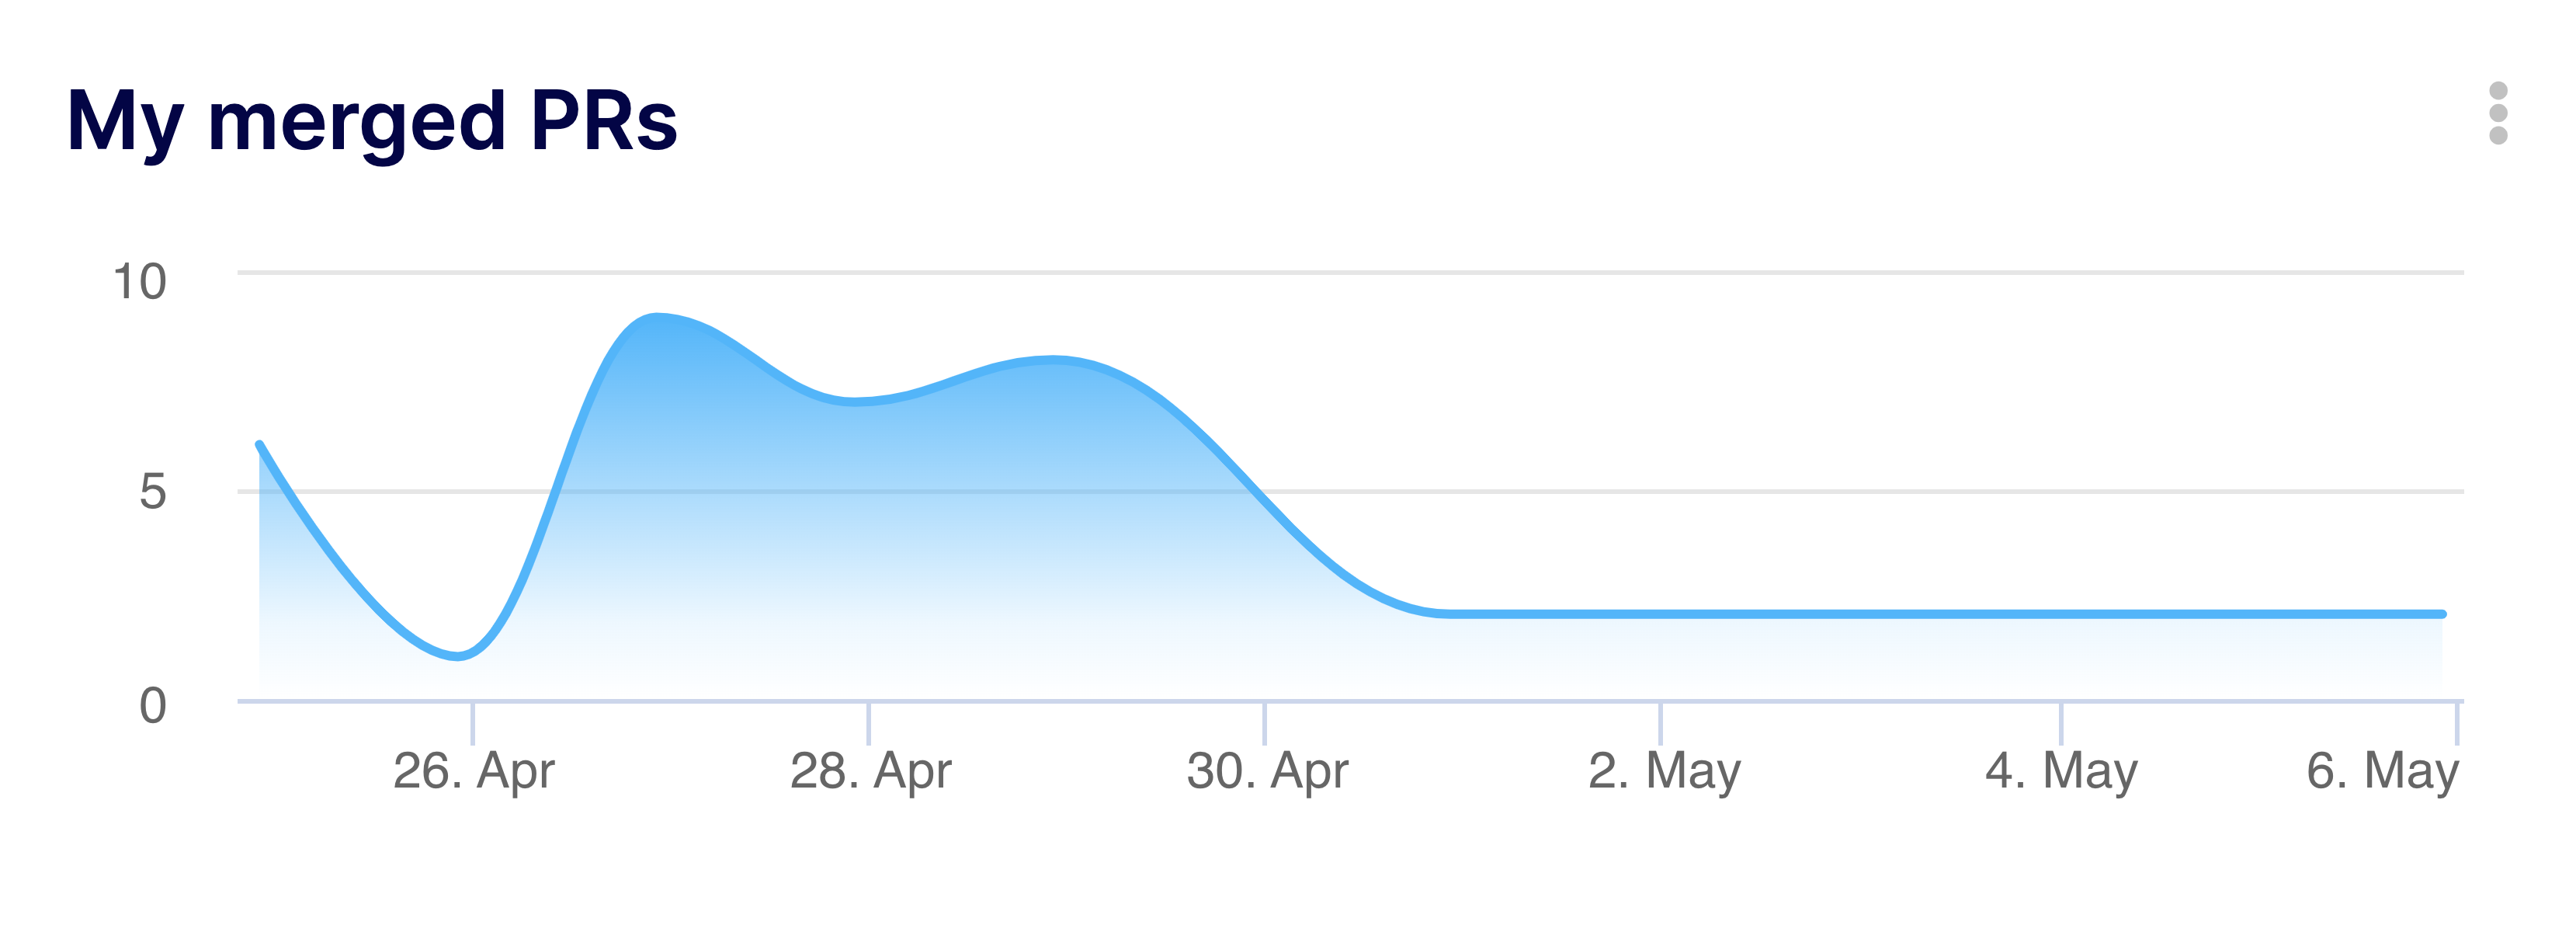
Review your merged pull requests over time to track your personal contribution history.

Focus on your current sprint commitments by listing all your assigned open tasks.
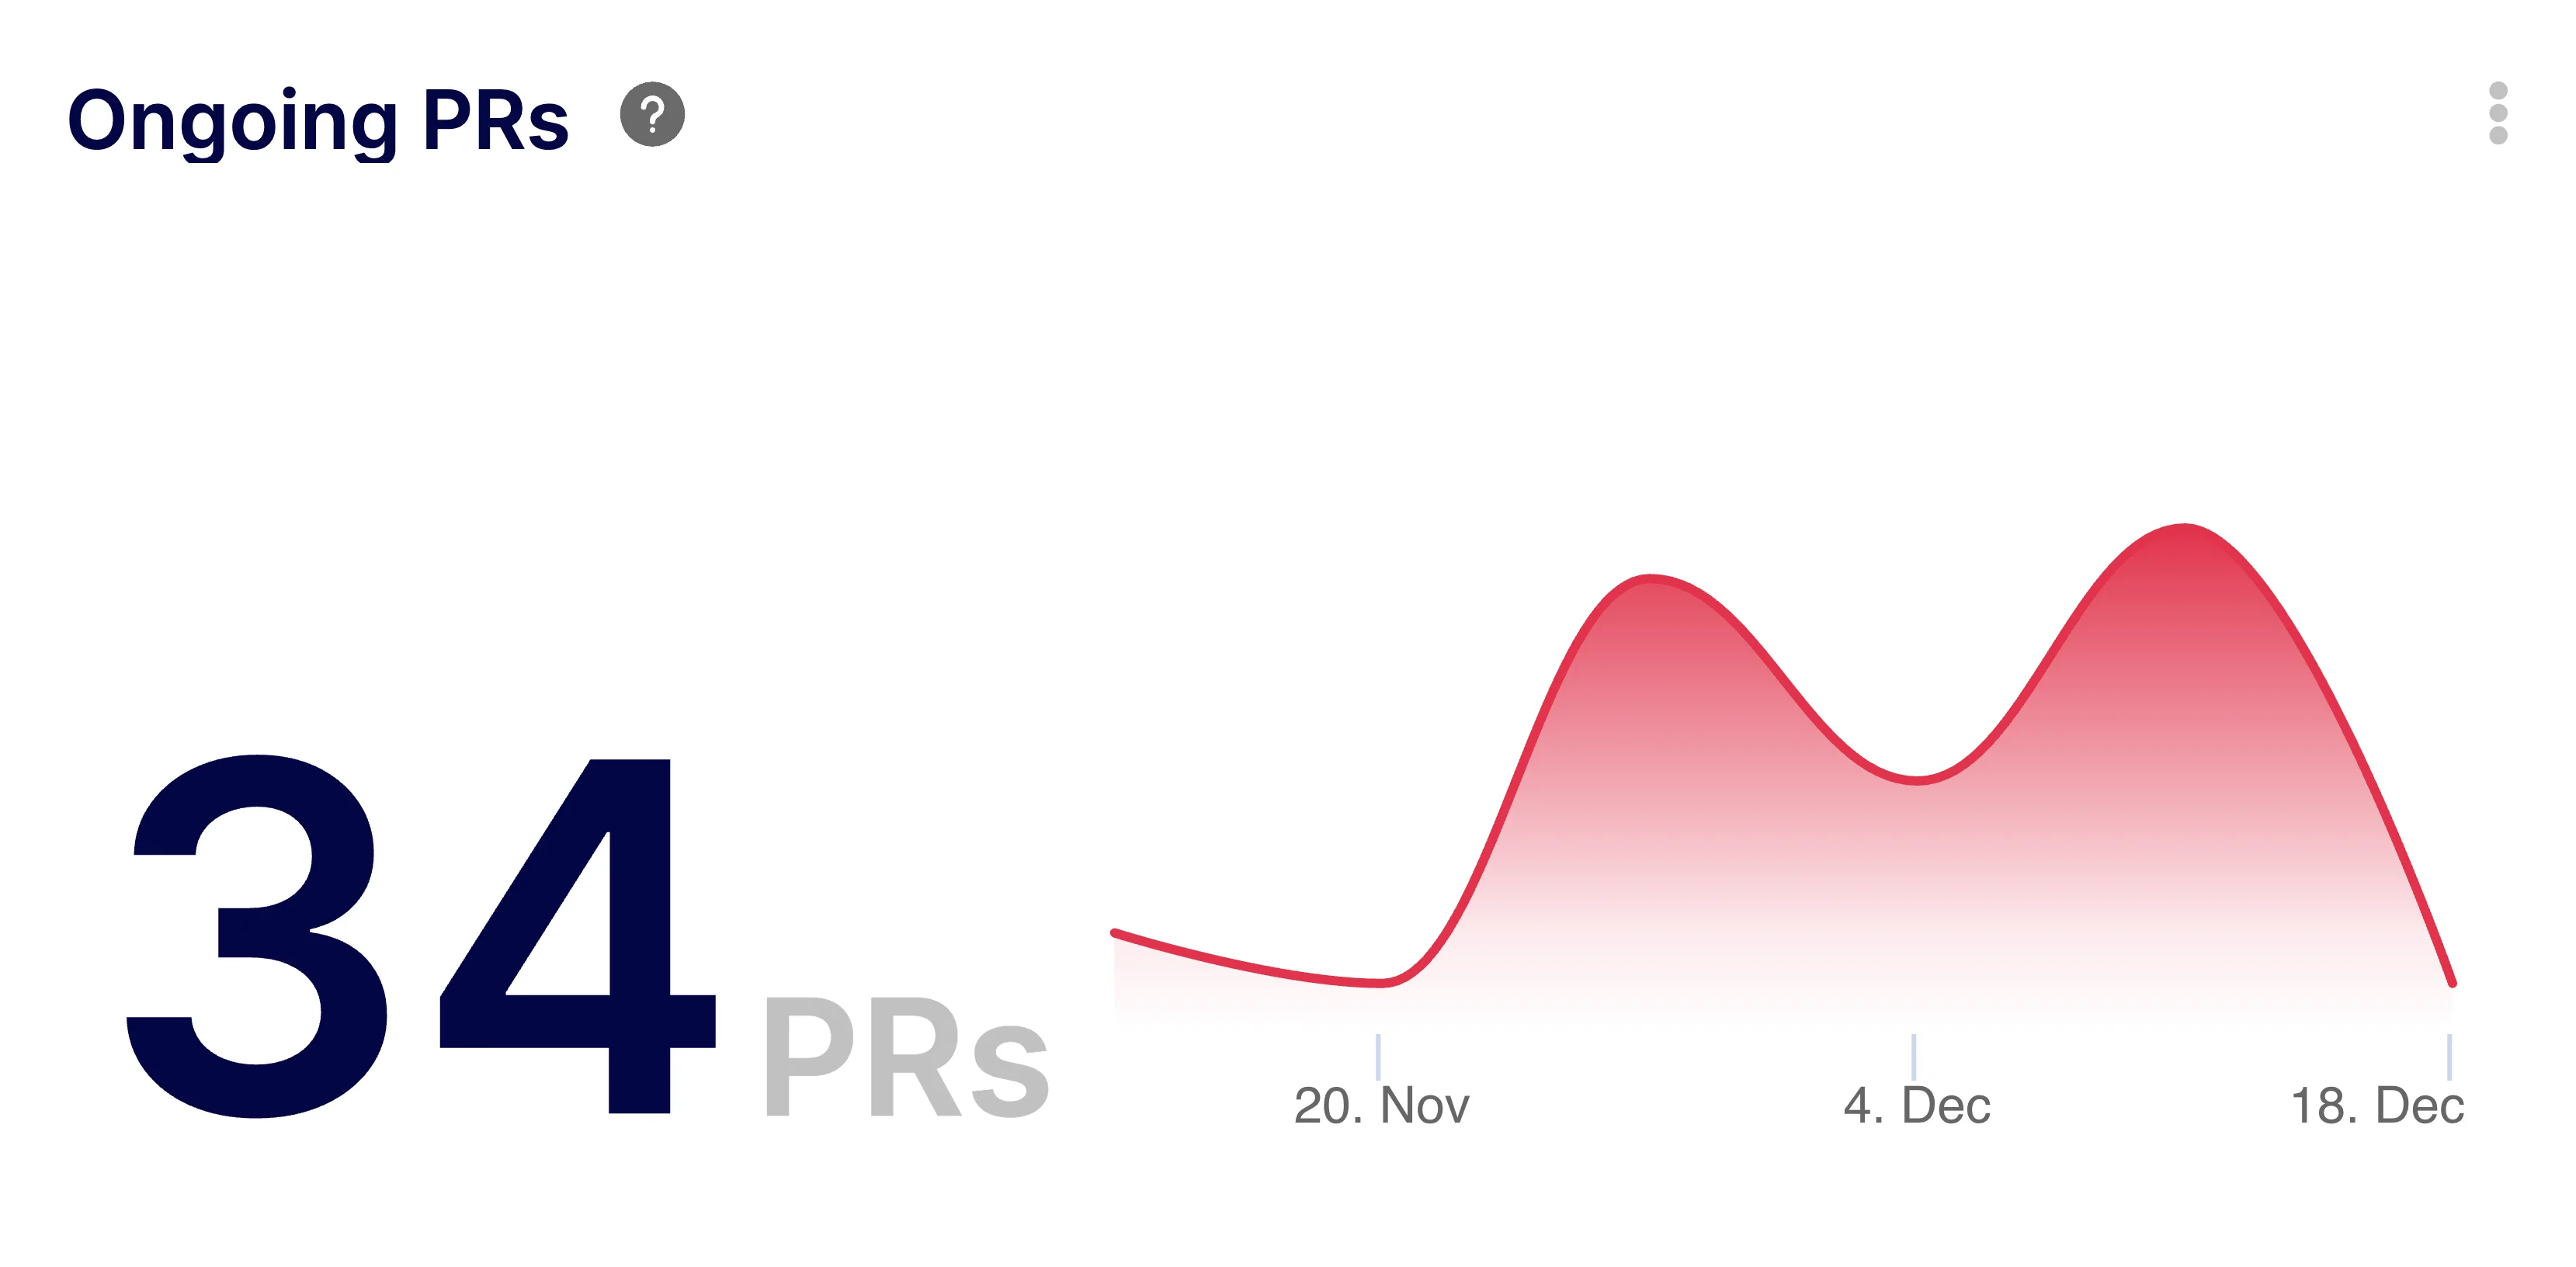
Monitor all active pull requests to ensure code review momentum and unblock dependencies.
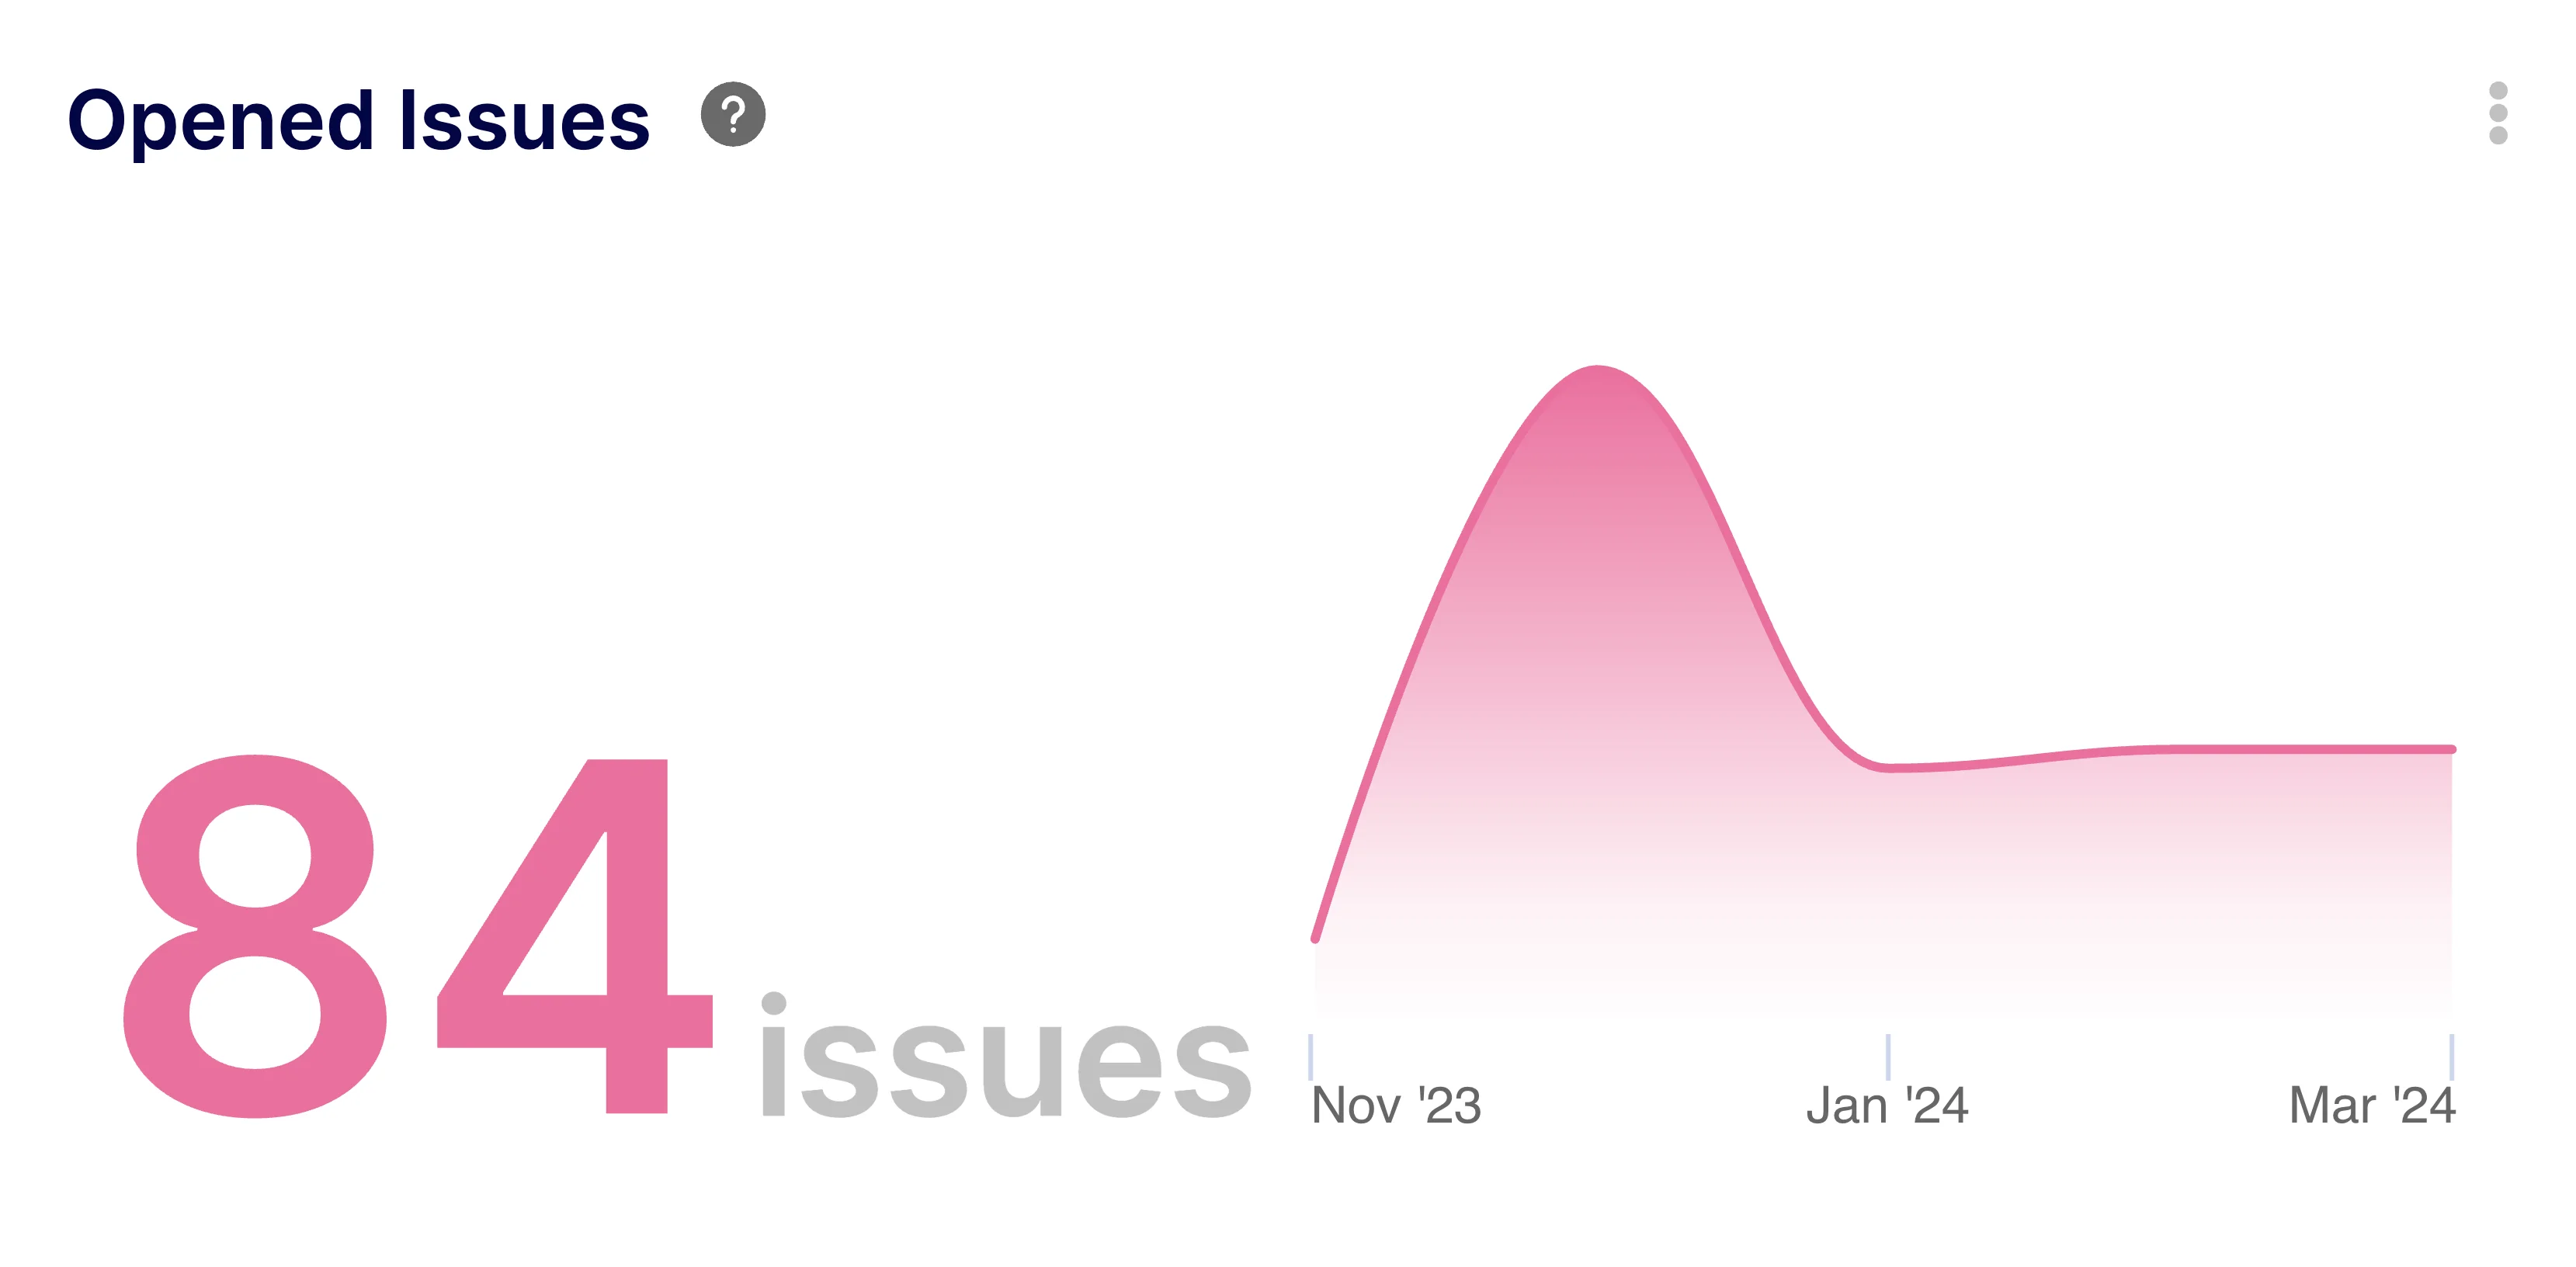
Track the inflow of new issues to anticipate workload spikes and backlog growth.
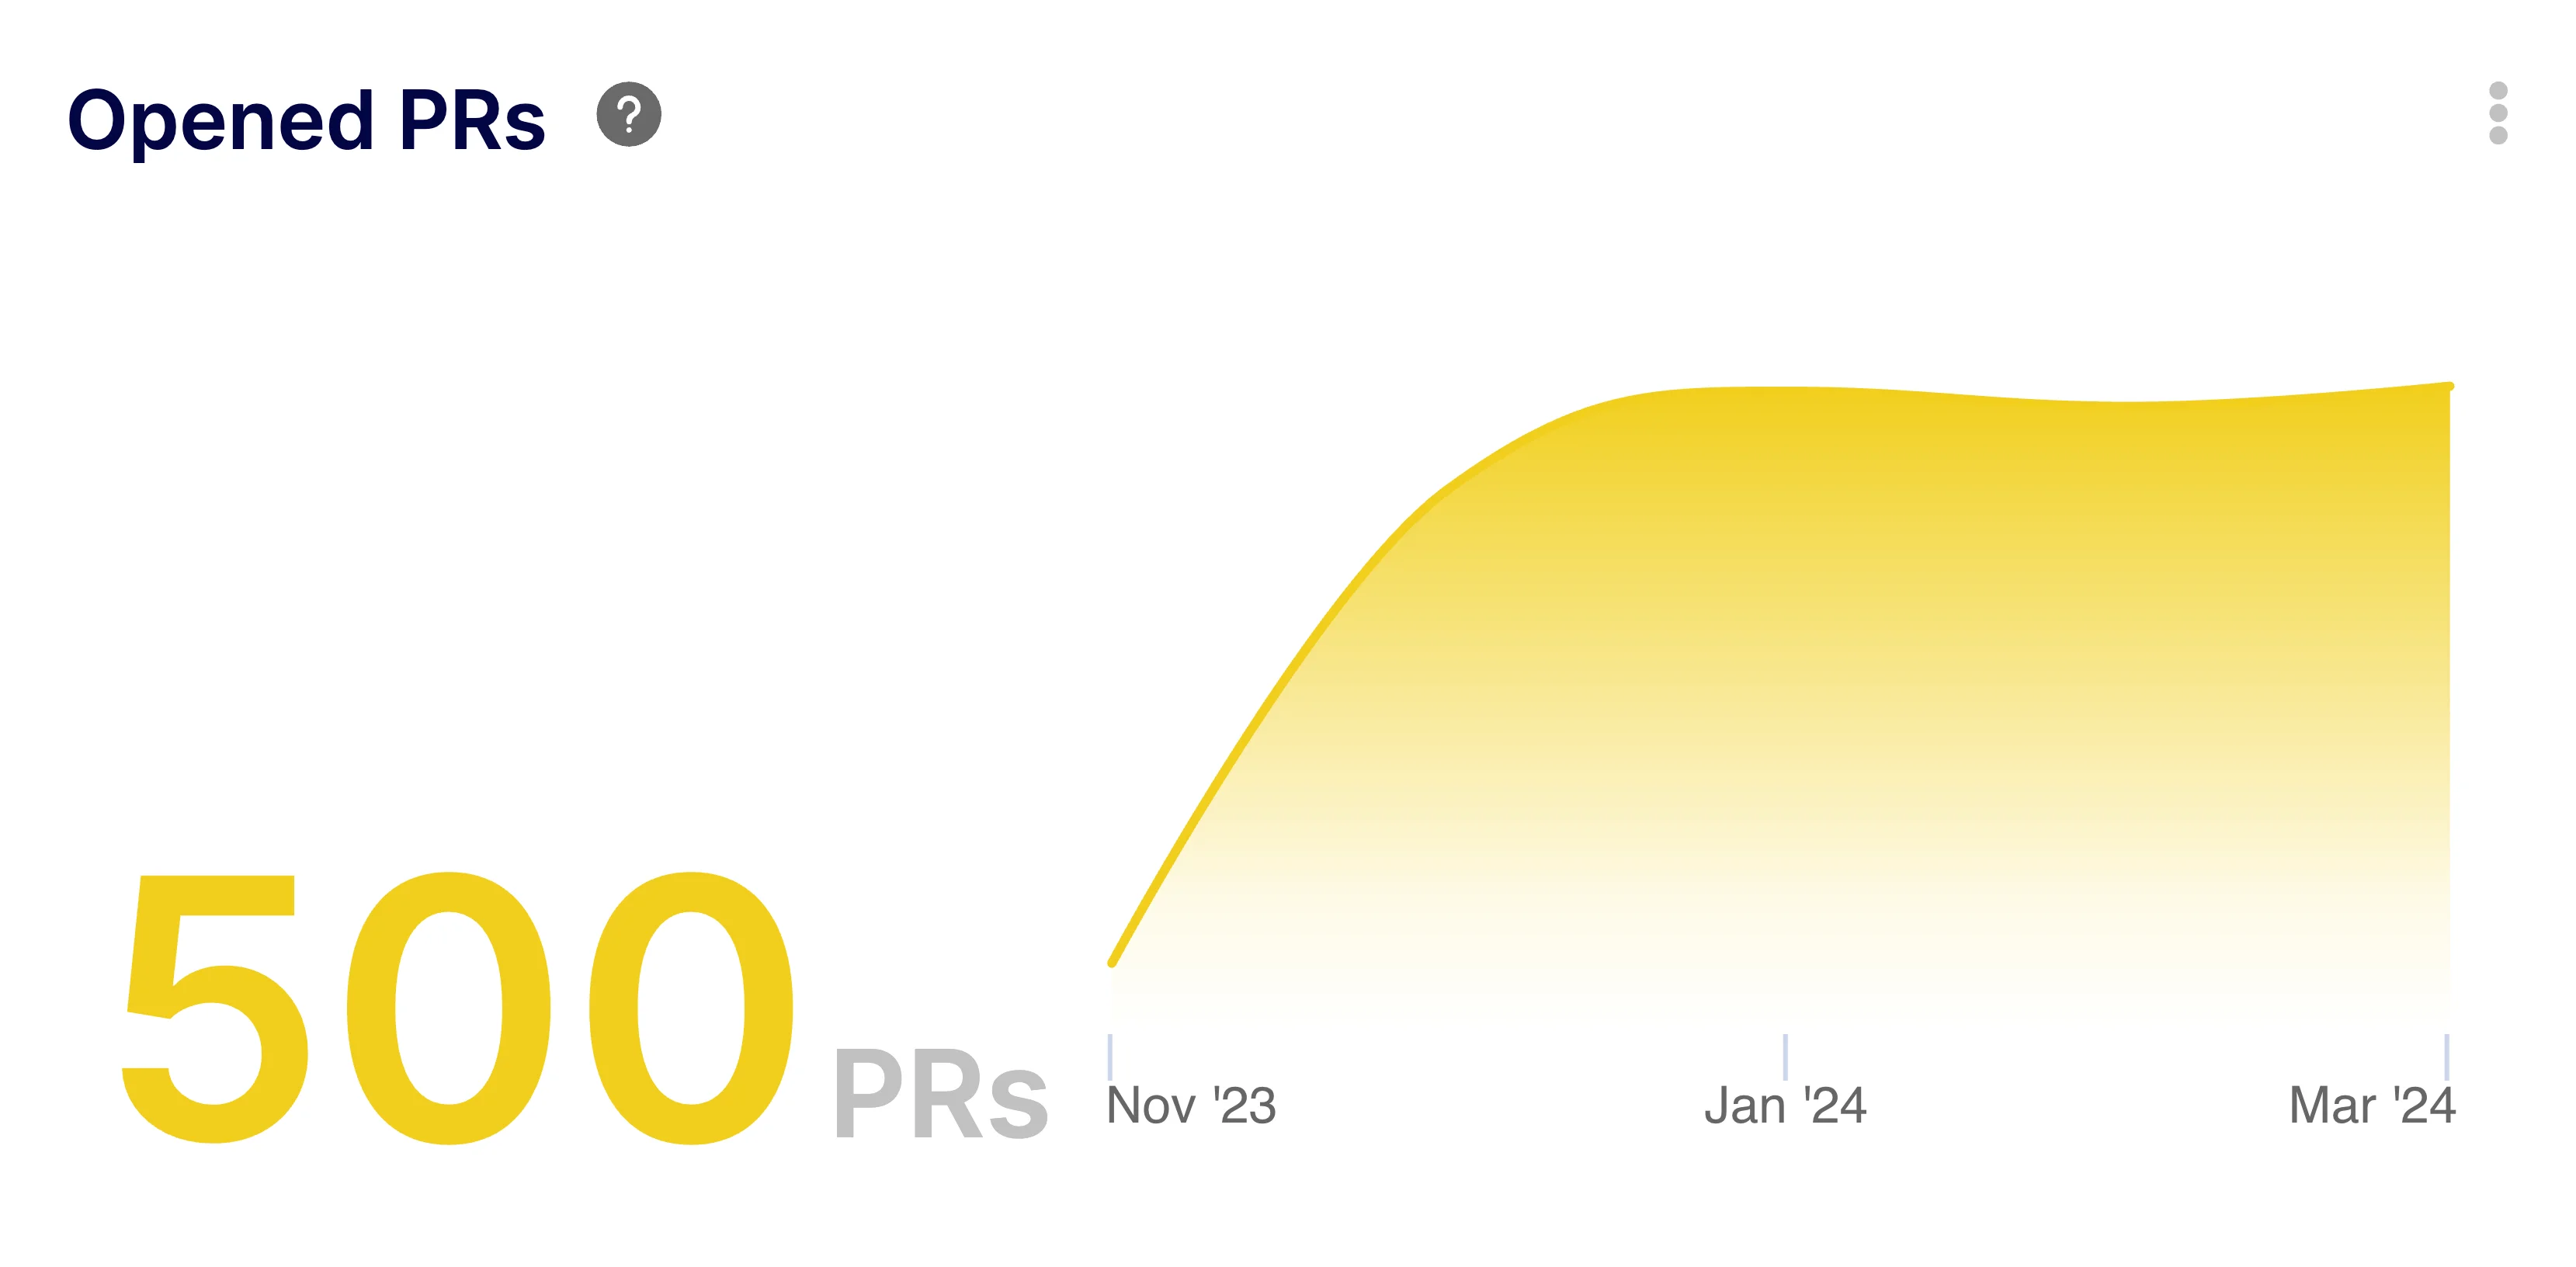
Measure the volume of new pull requests to gauge development activity and review demand.
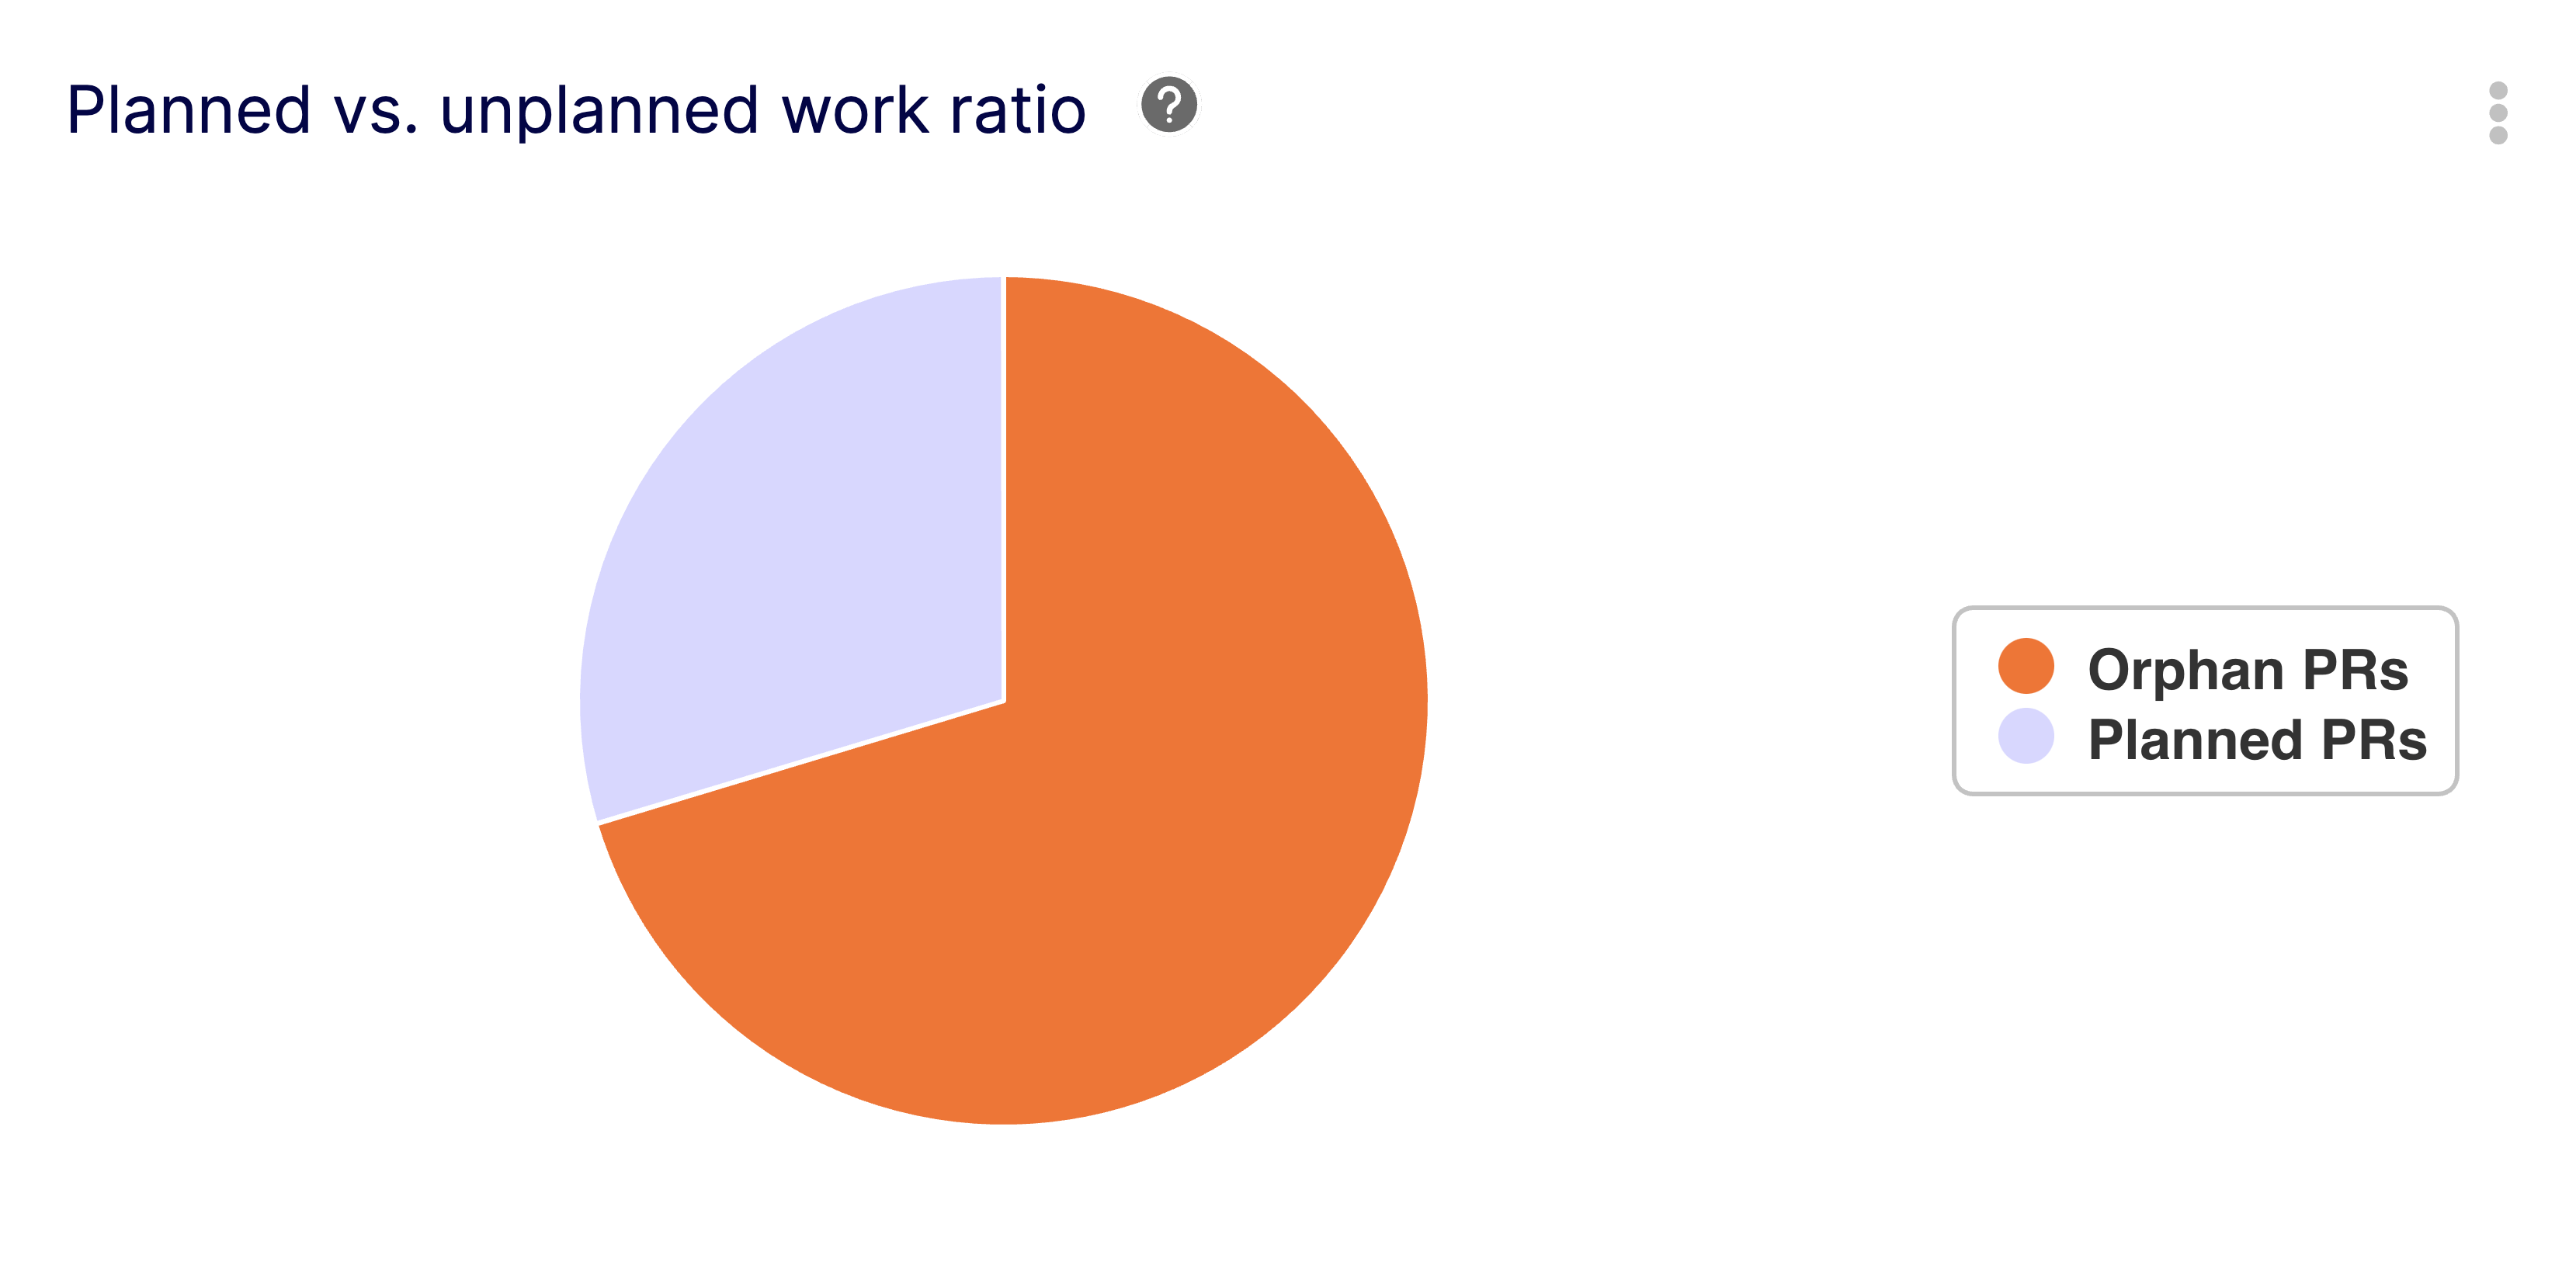
Compare planned vs. unplanned work to improve sprint predictability and reduce scope creep.
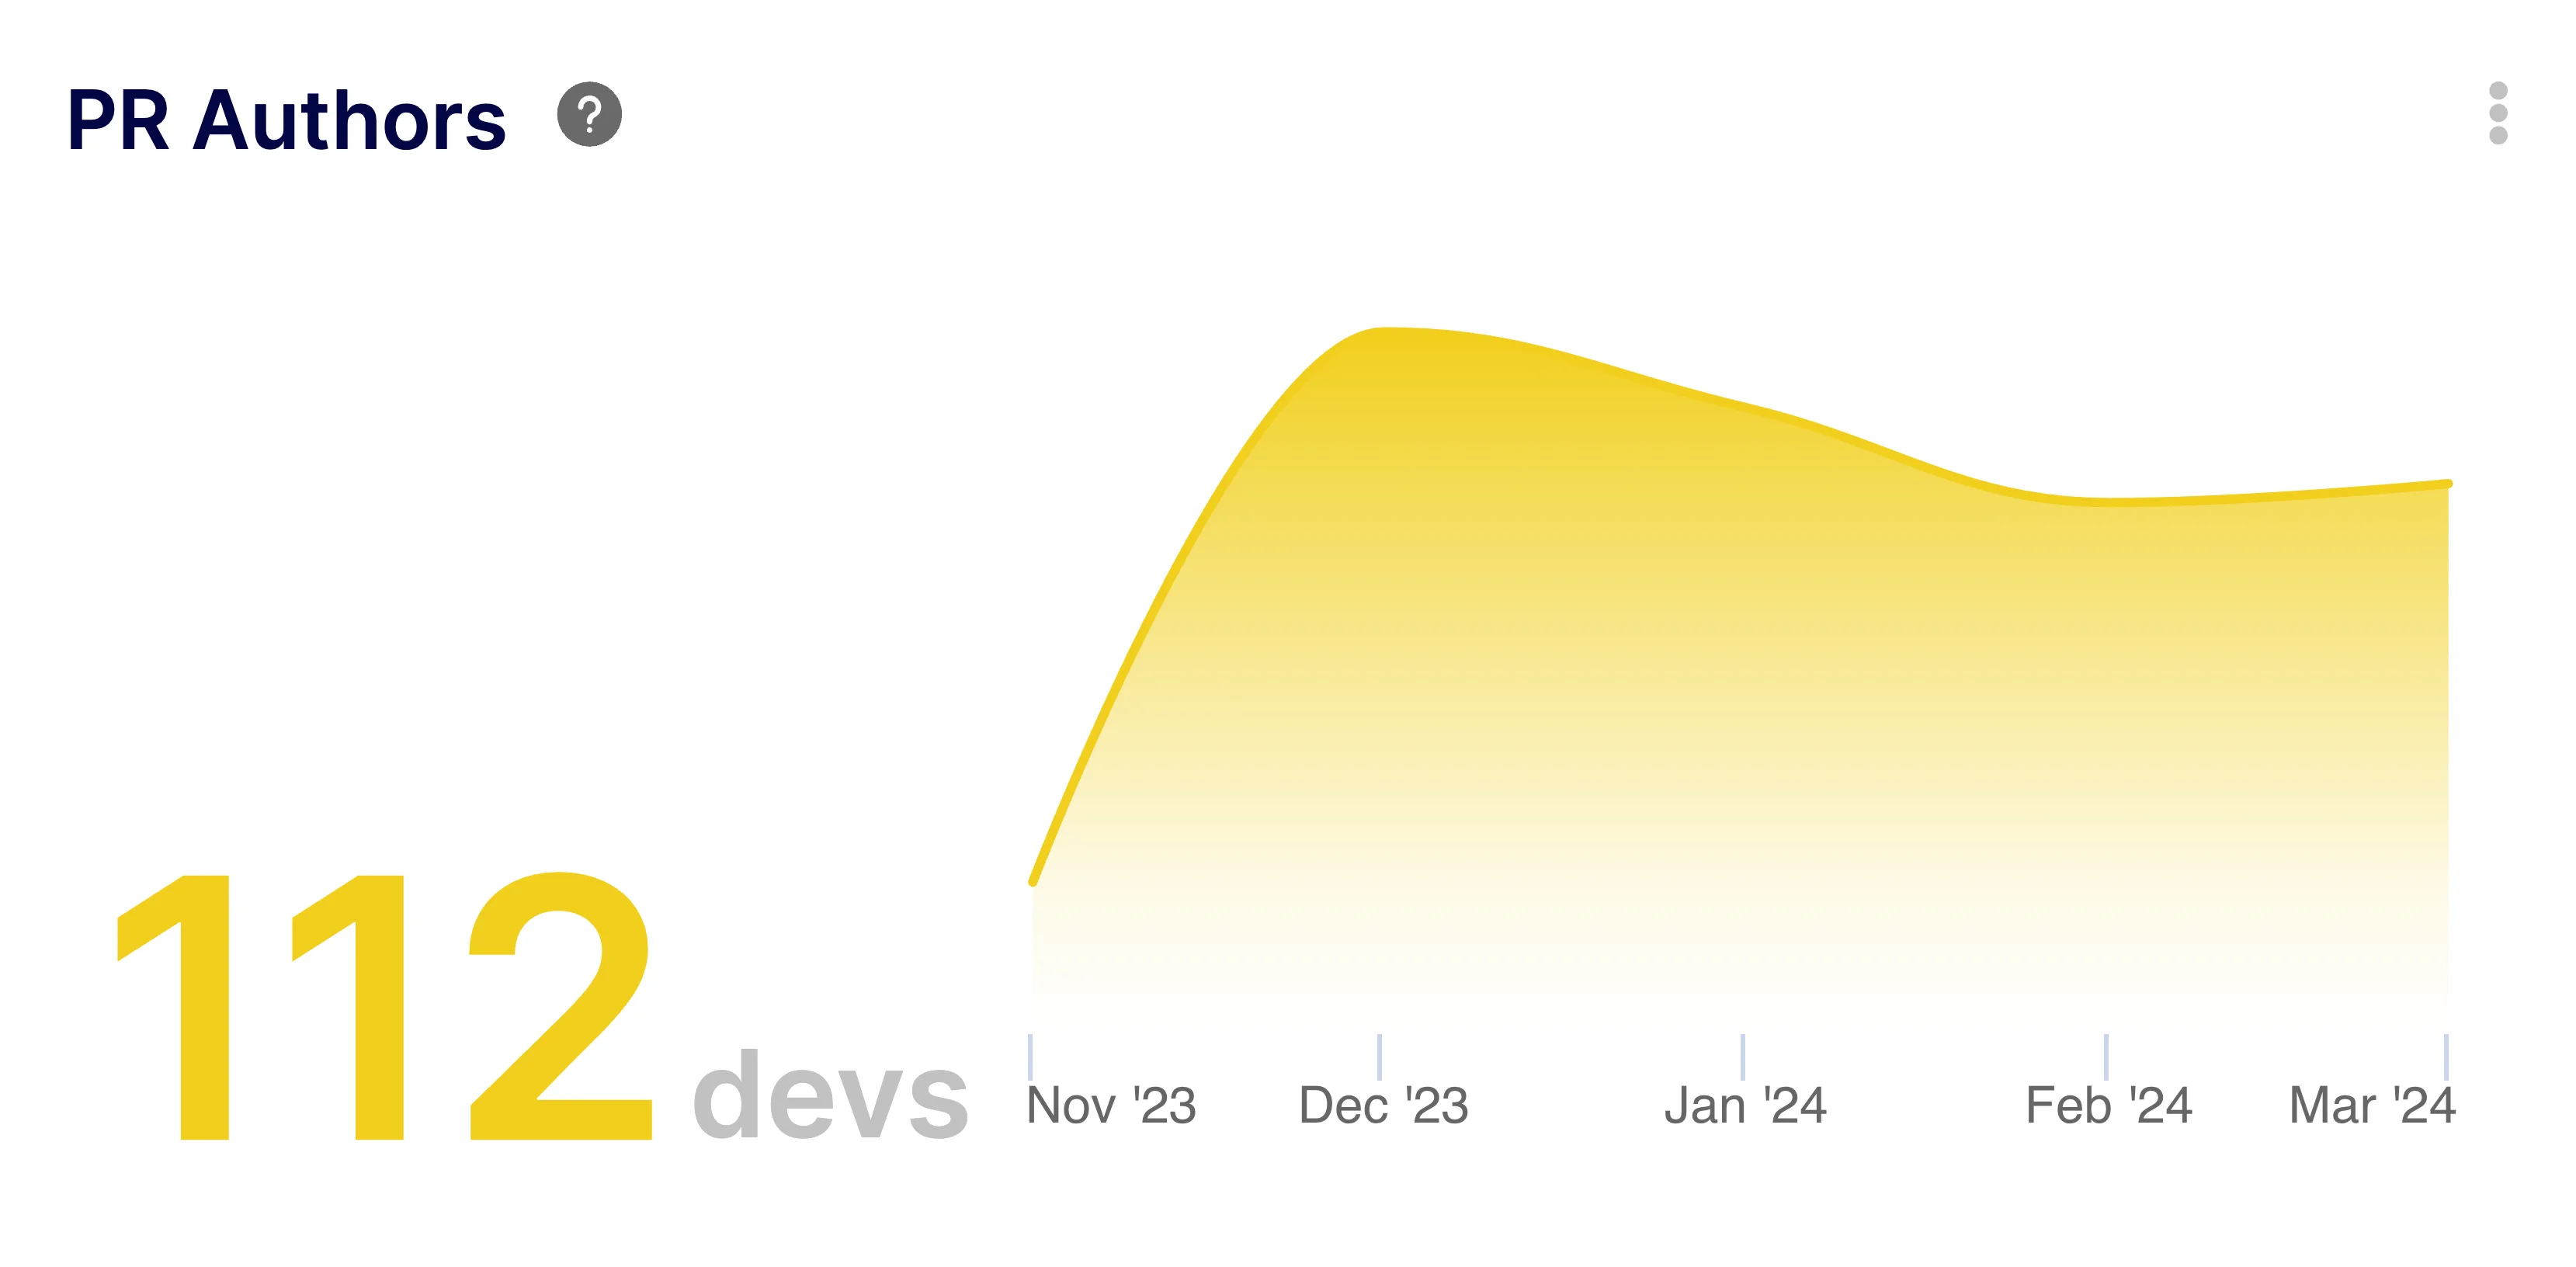
Identify contributors and their activity levels to foster a culture of shared ownership.
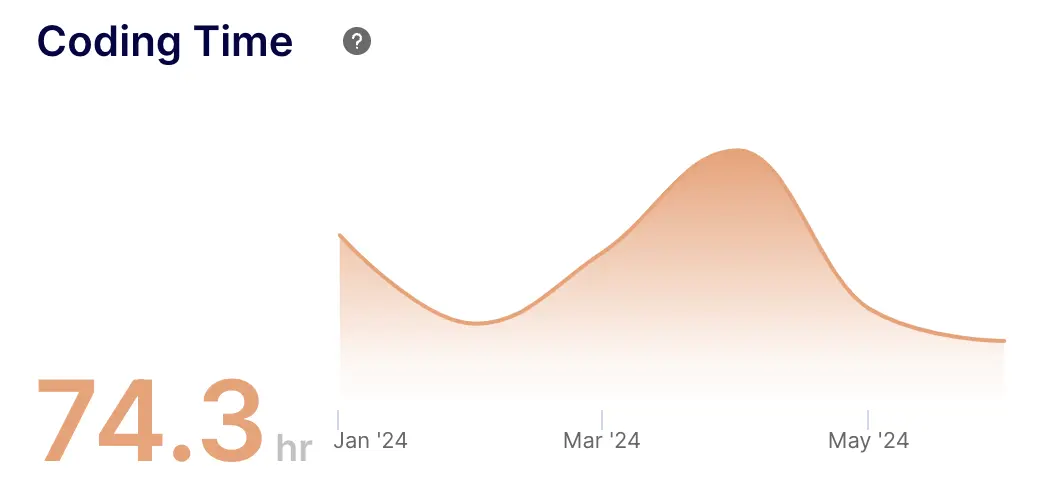
Measure the time spent coding to identify complexity and potential scope issues early.
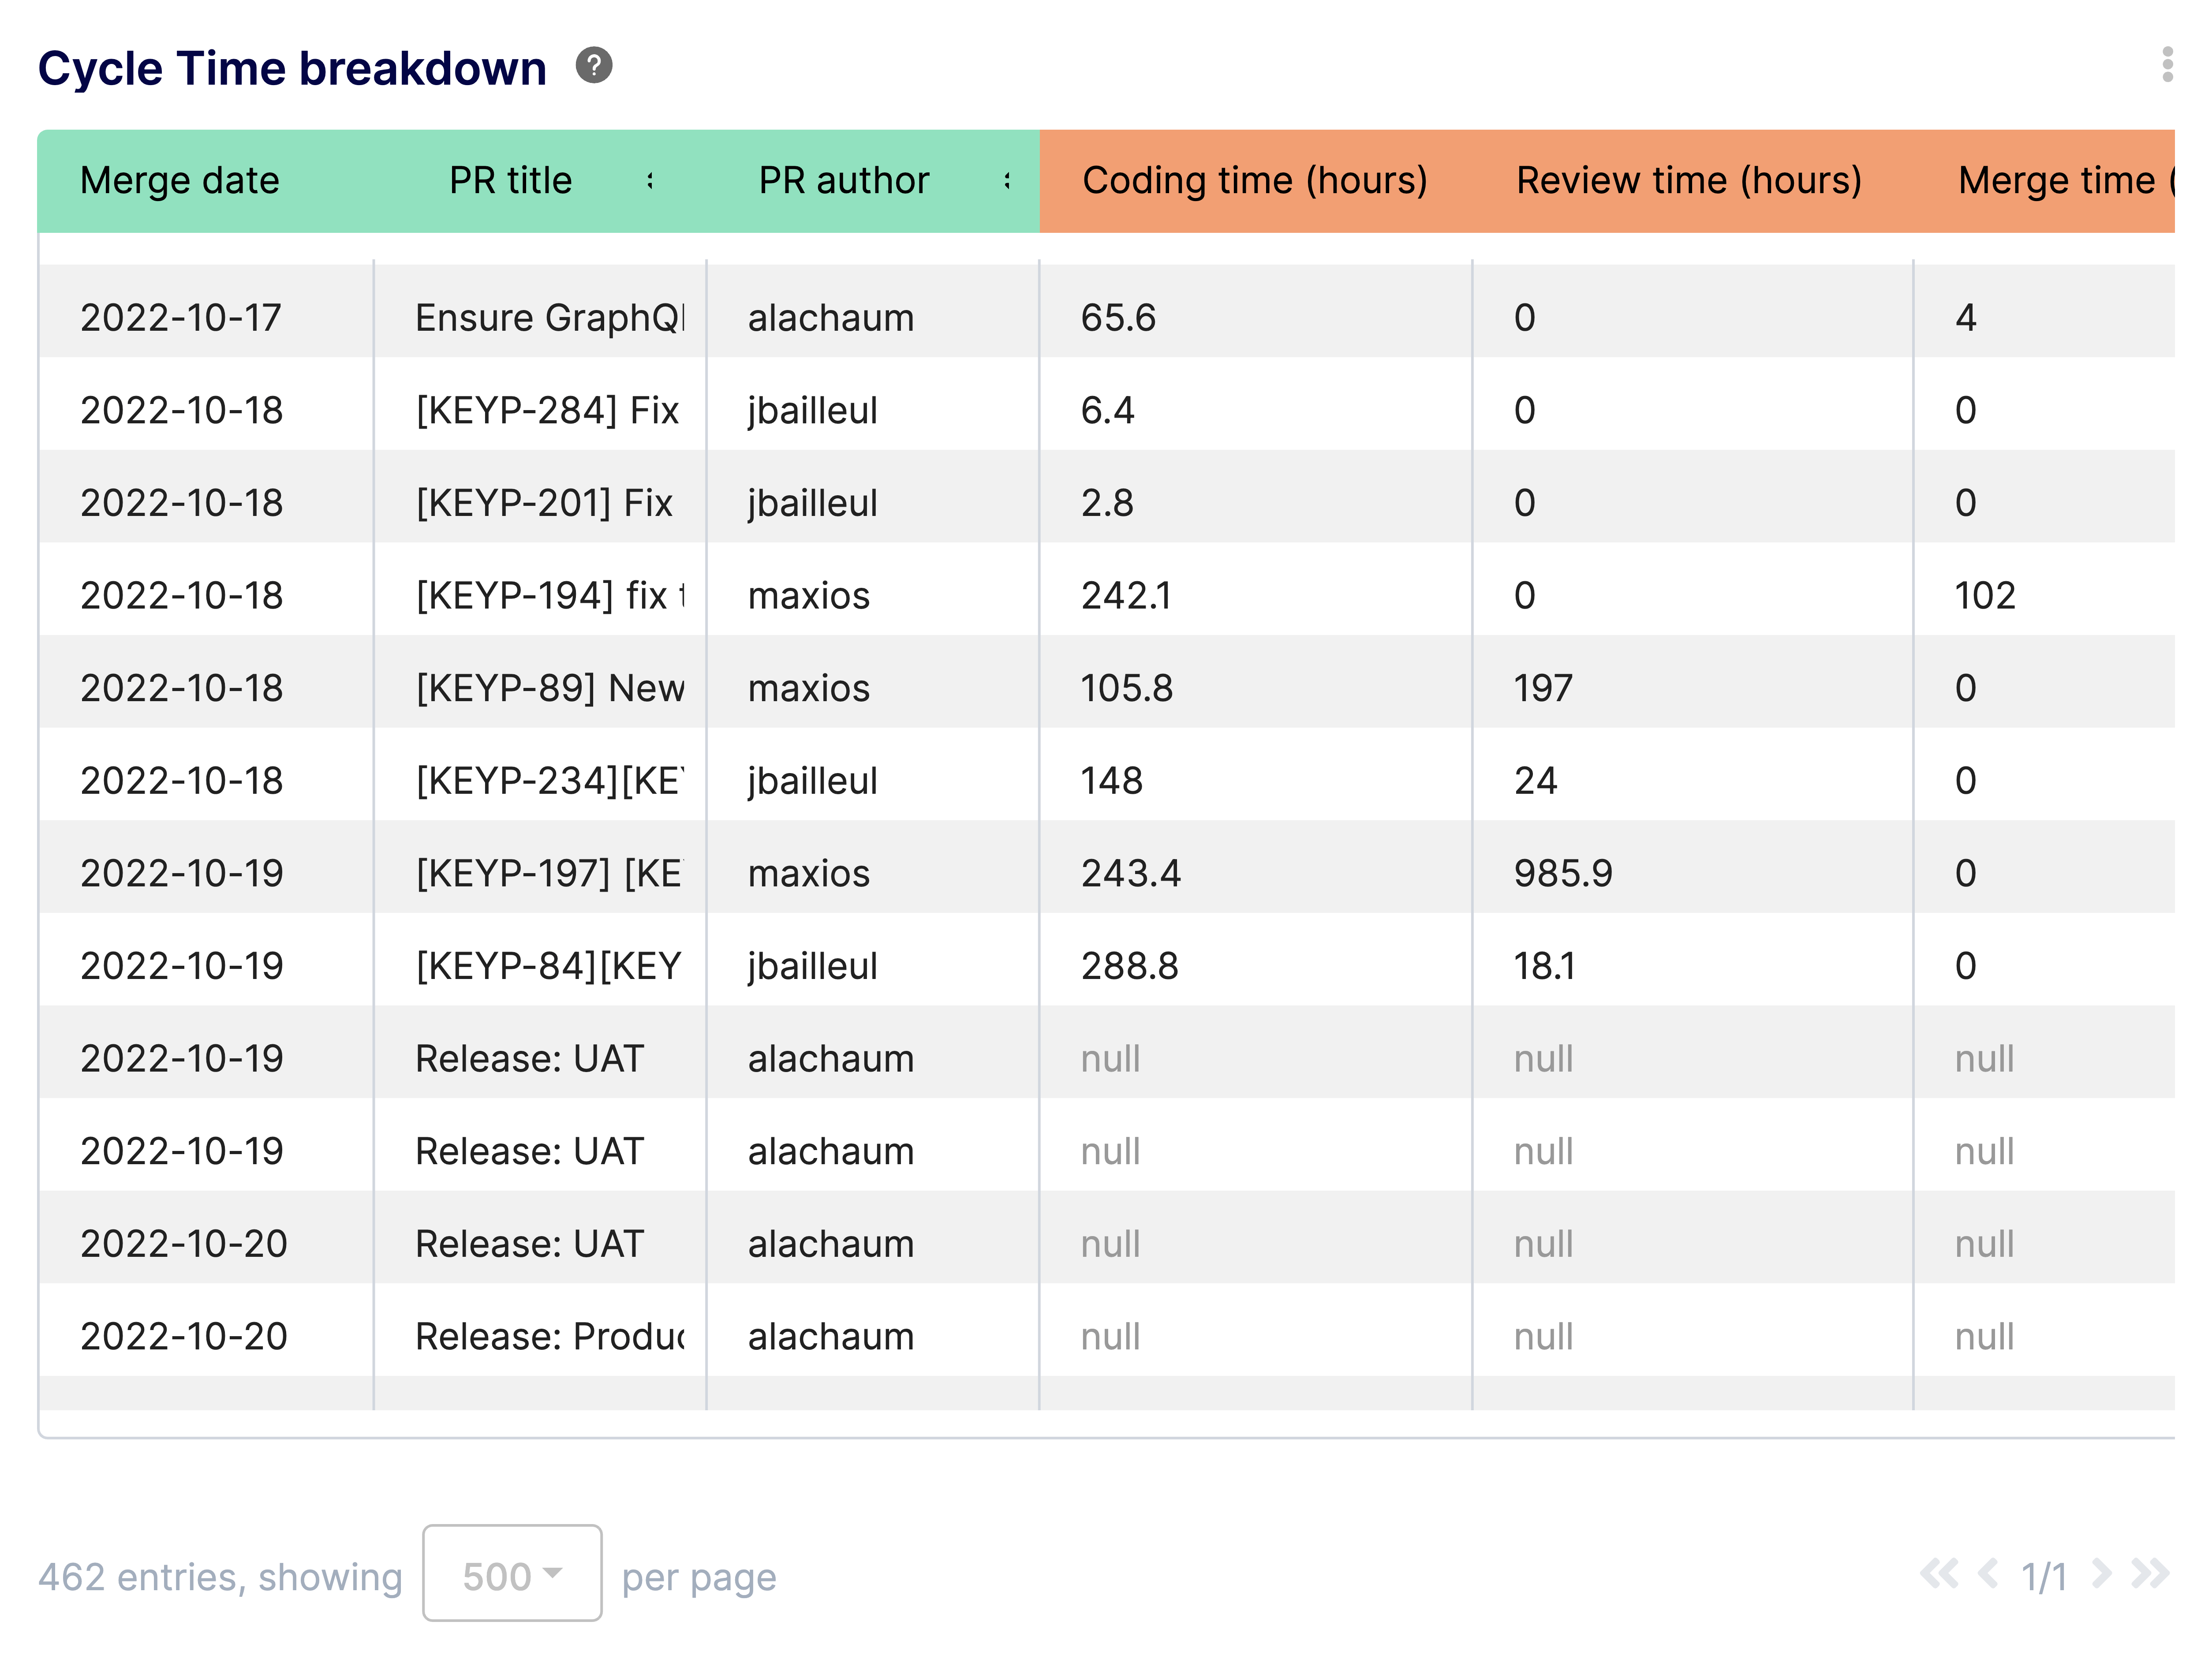
Analyze each stage of the PR lifecycle to streamline reviews and accelerate approvals.
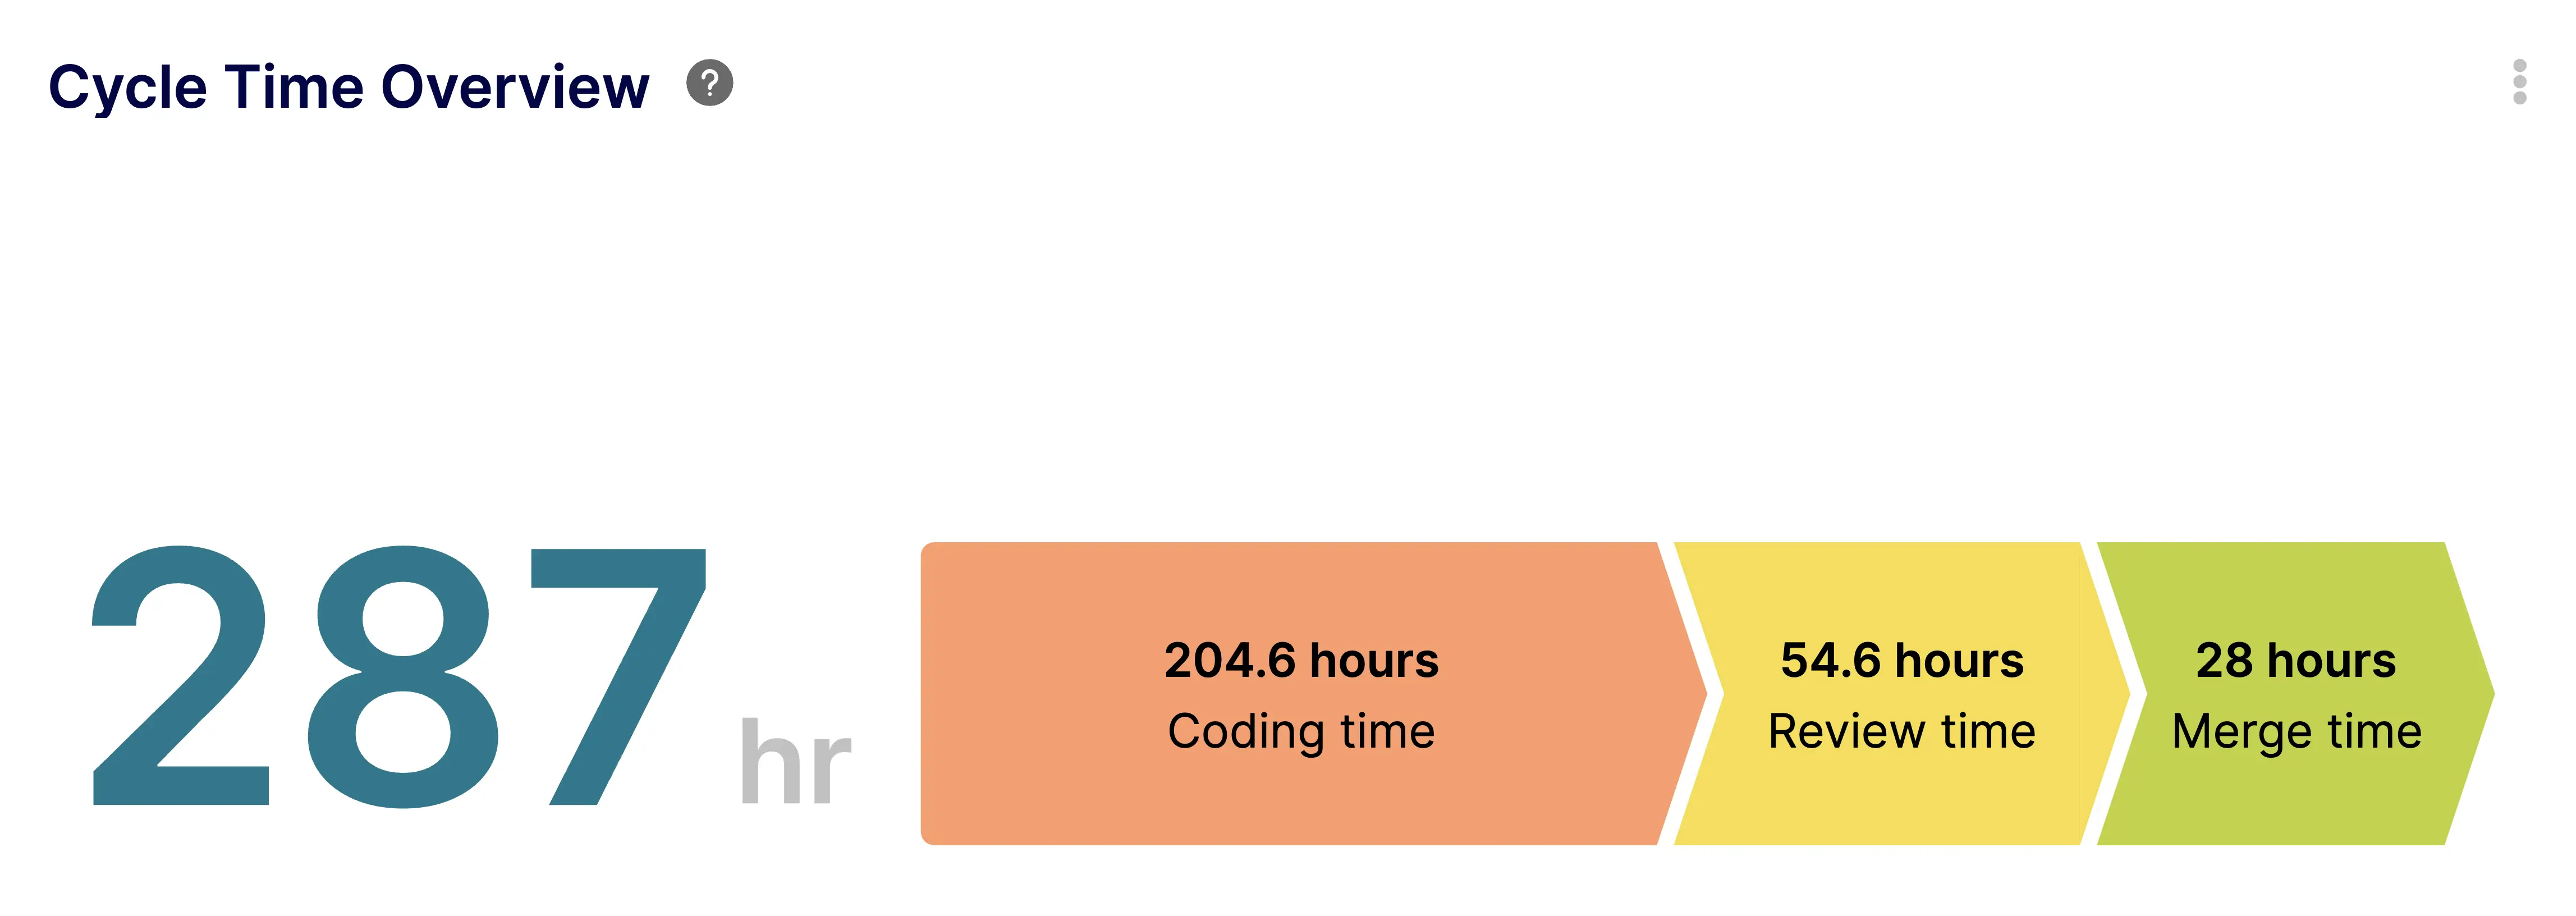
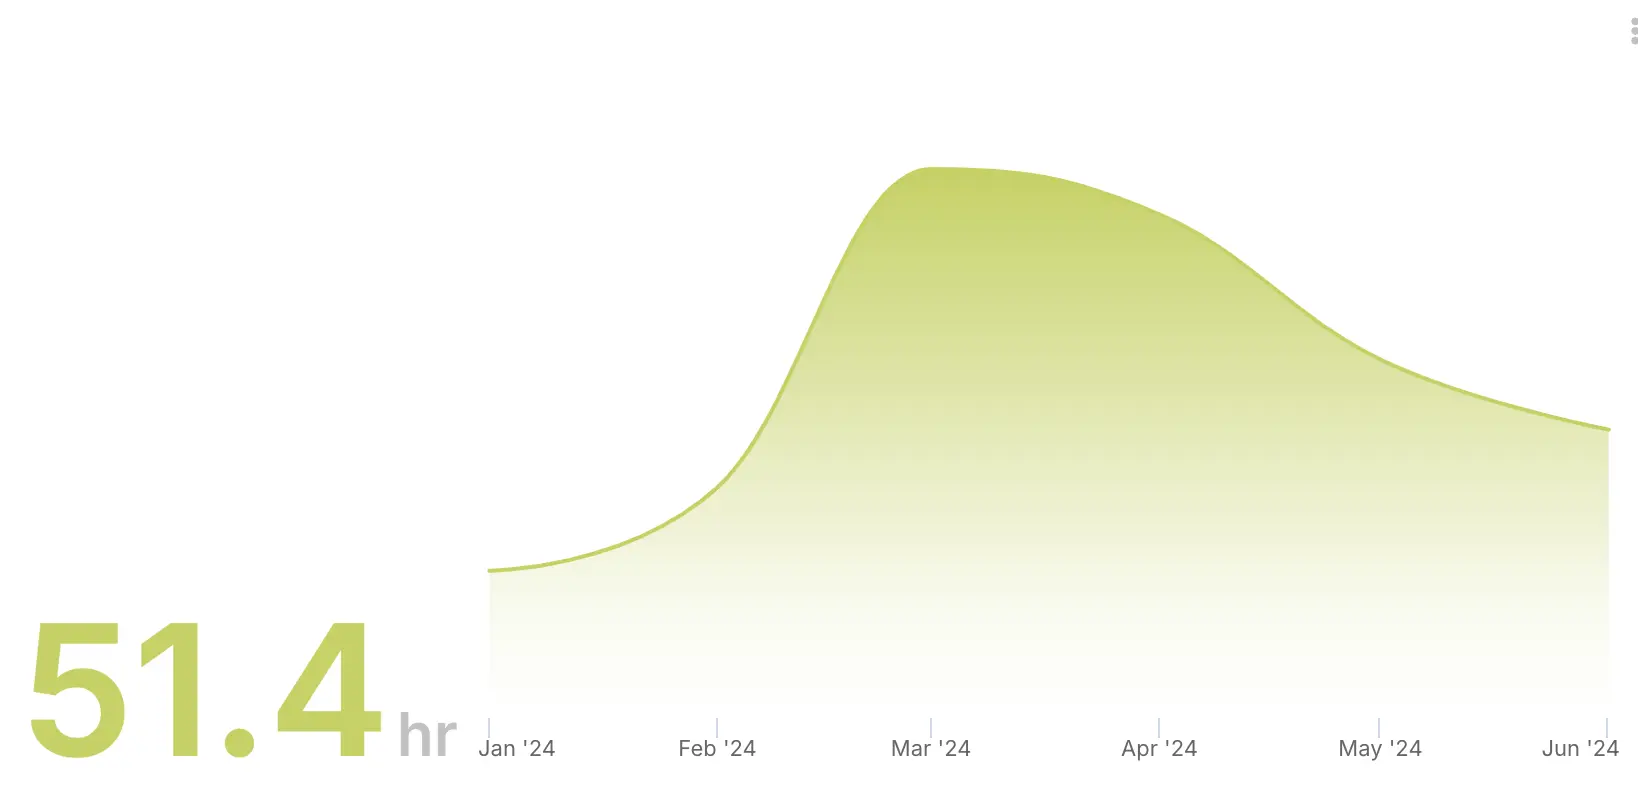
Track the total time from first commit to merge to evaluate overall delivery speed.
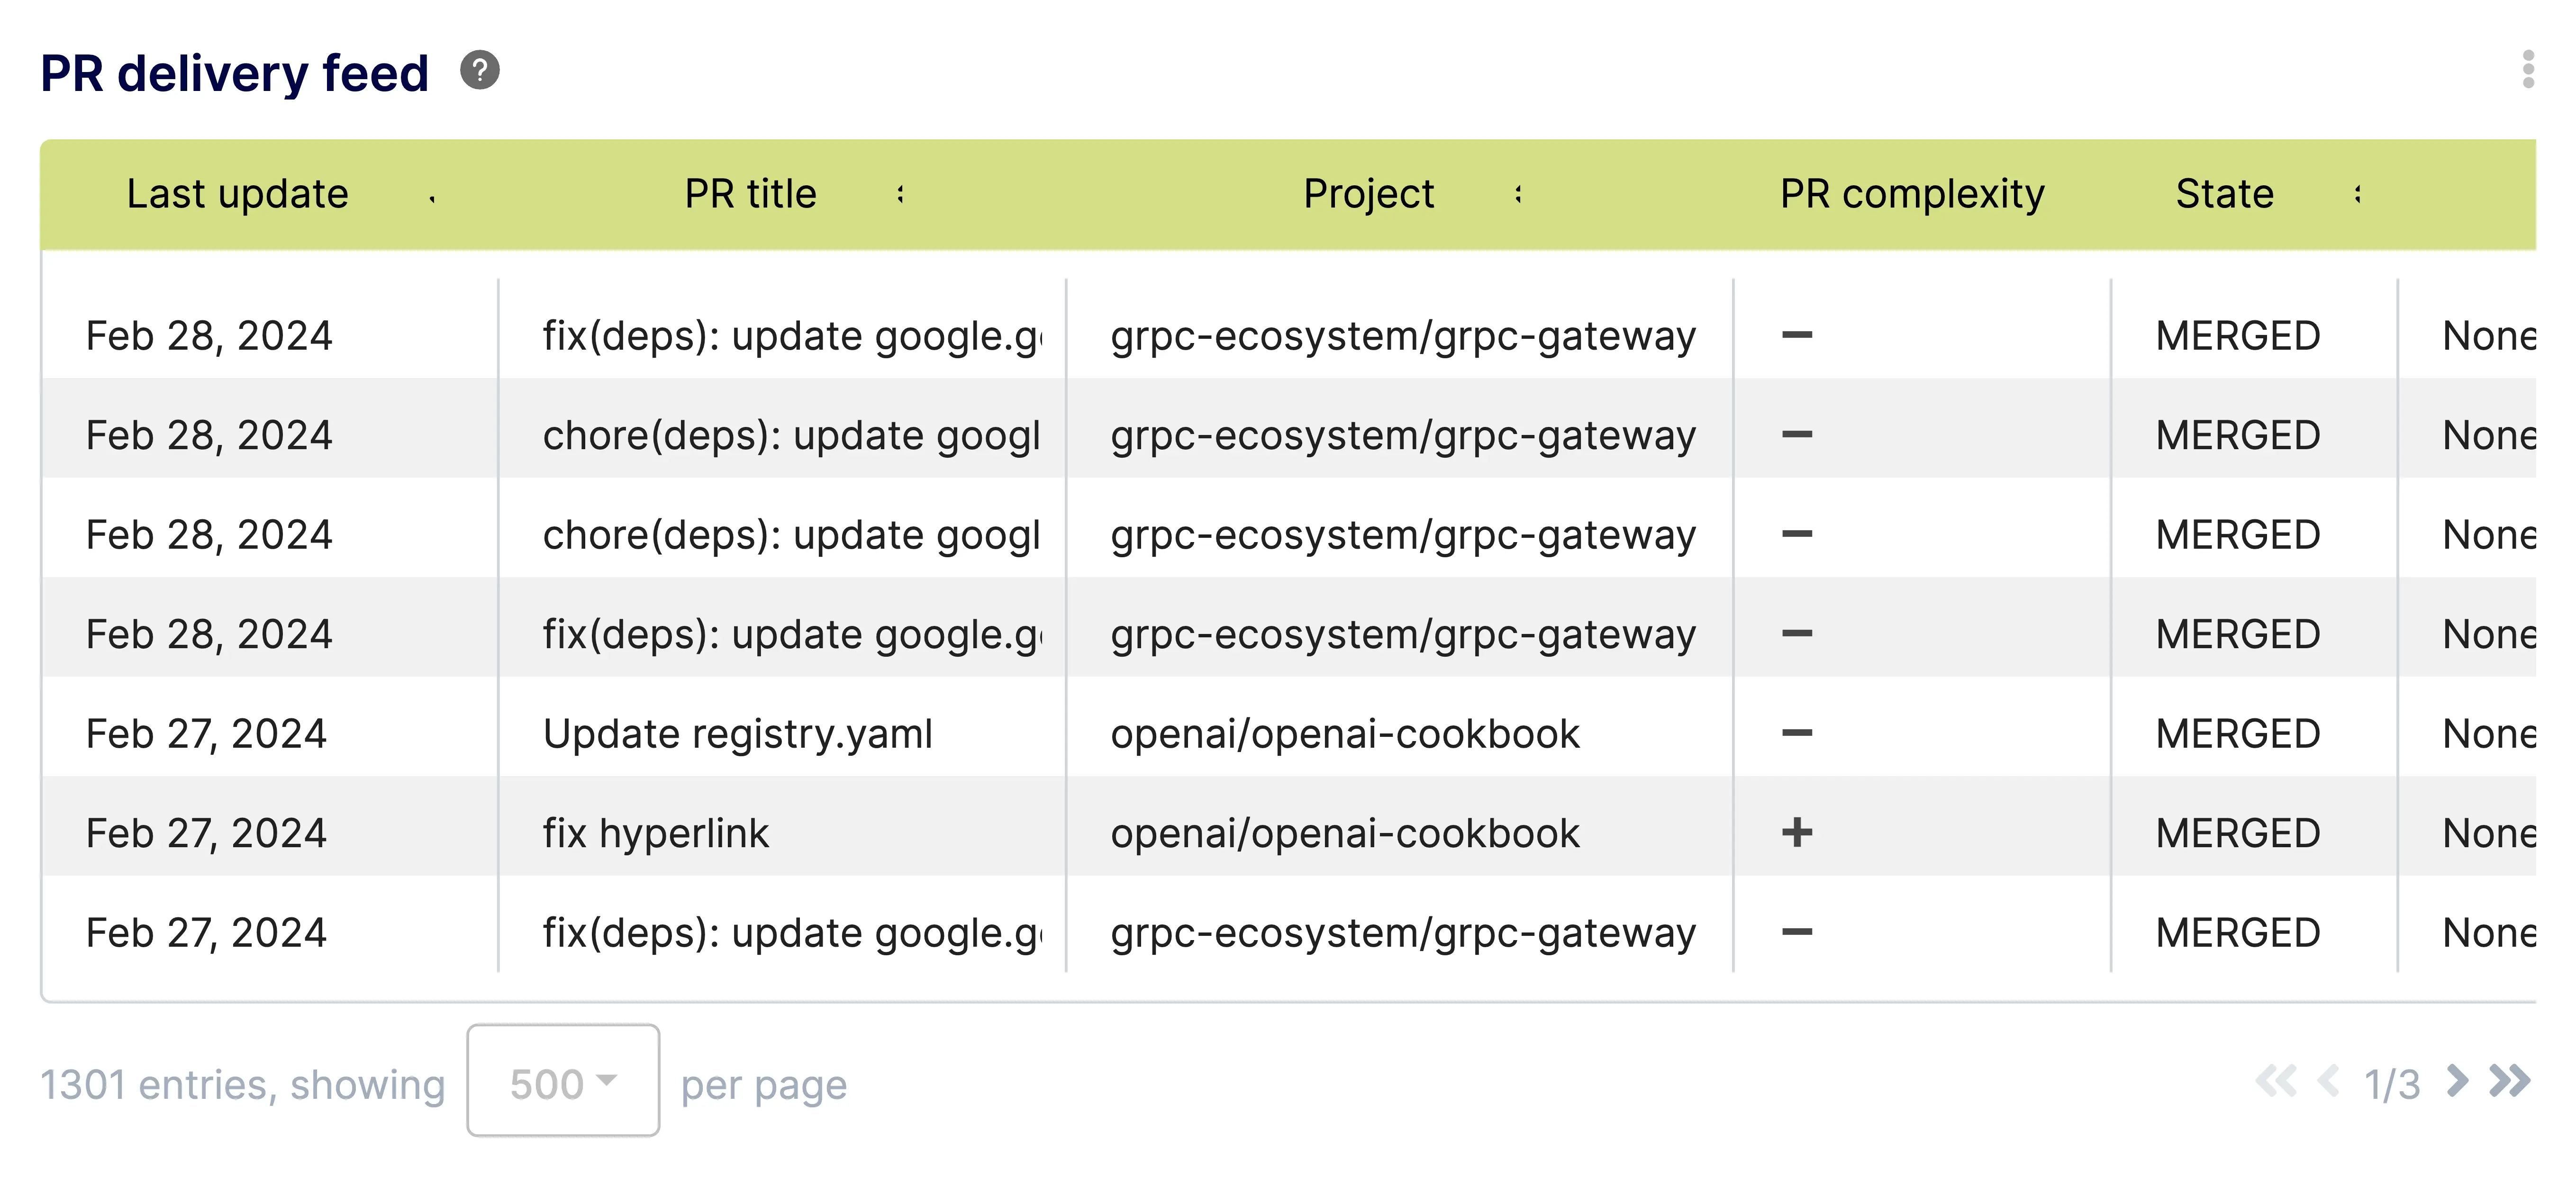
Get a live feed of PR activity to monitor progress and identify stuck reviews in real-time.
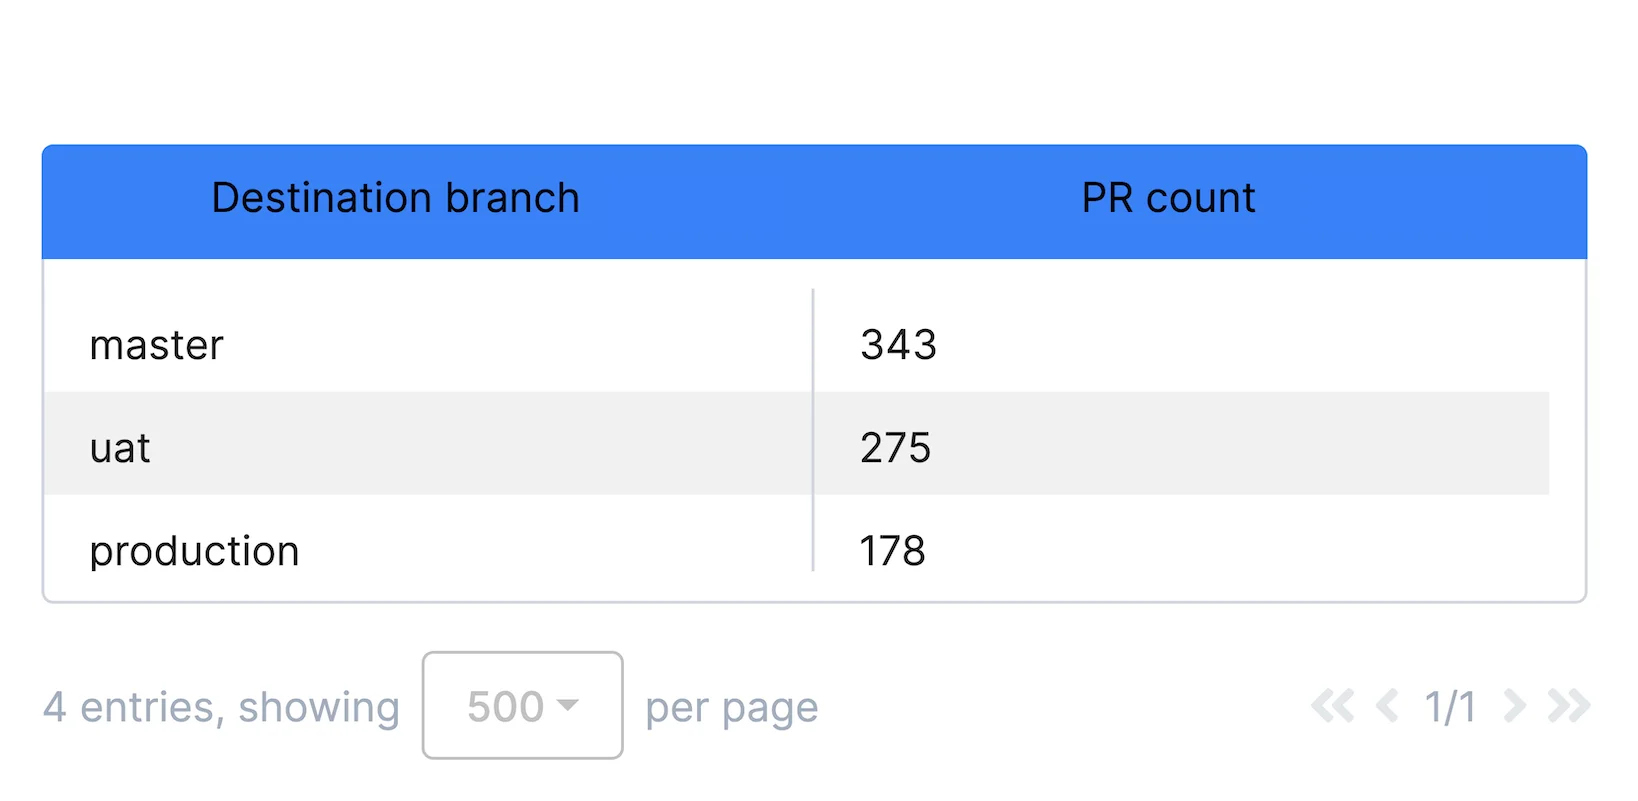
Monitor where code is being merged to ensure adherence to your branching strategy.
Identify inactive pull requests to restart momentum and reduce time-to-merge.
Track the time between approval and merge to optimize your deployment pipeline.
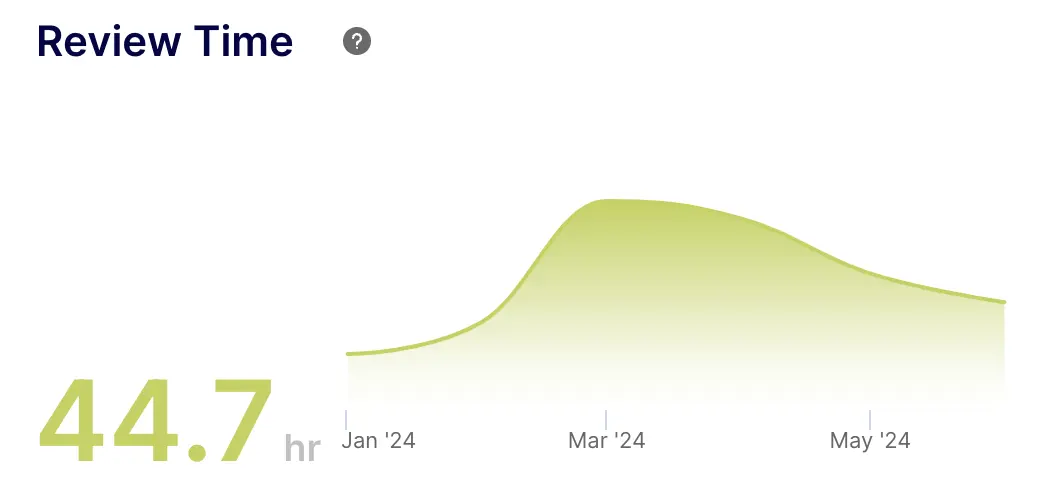
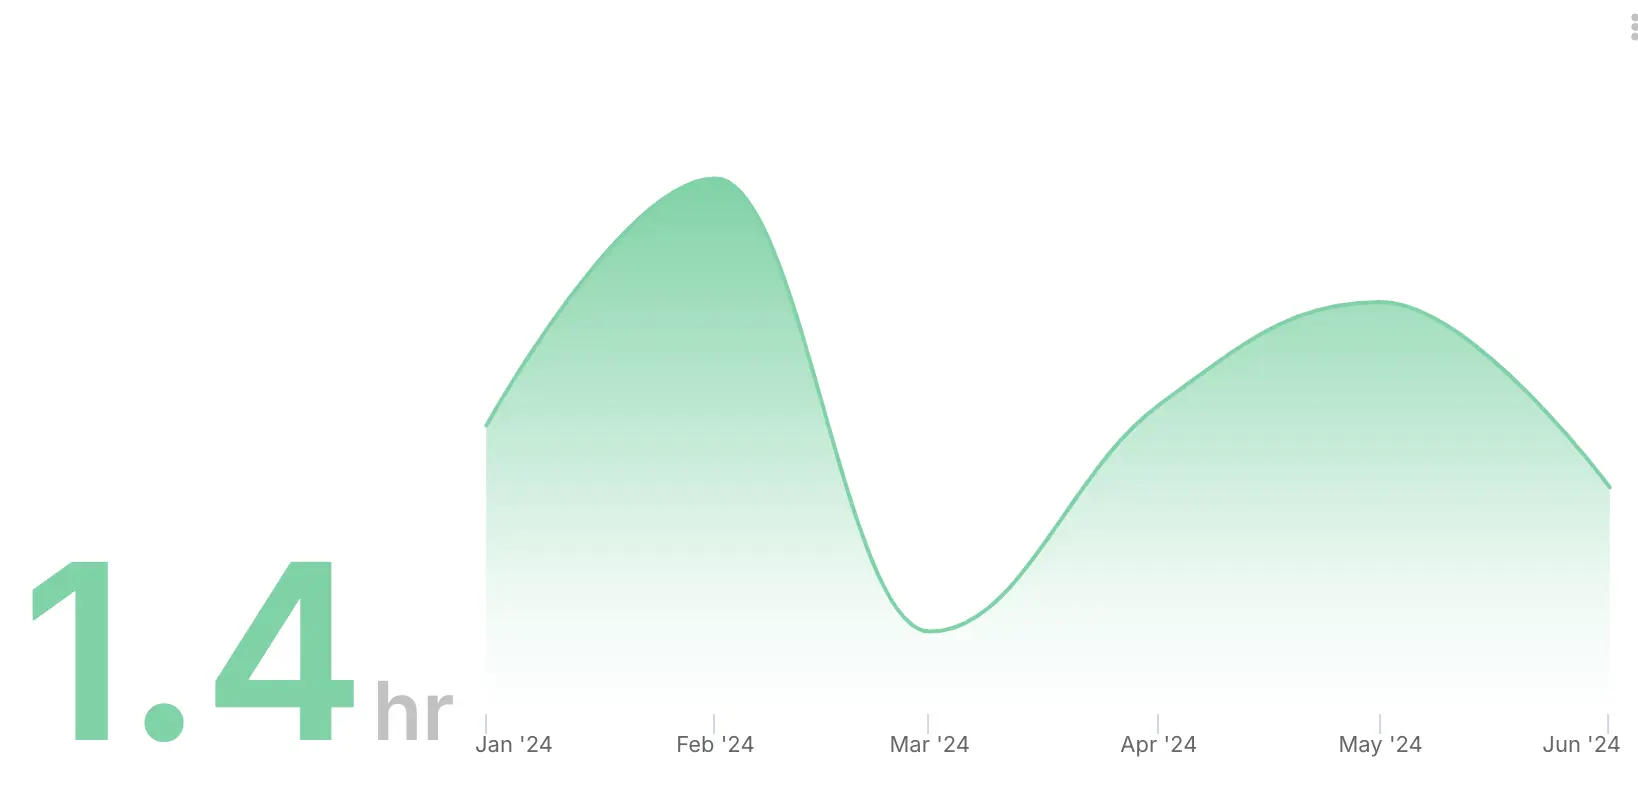
Measure how long reviews take to improve team responsiveness and code quality loops.
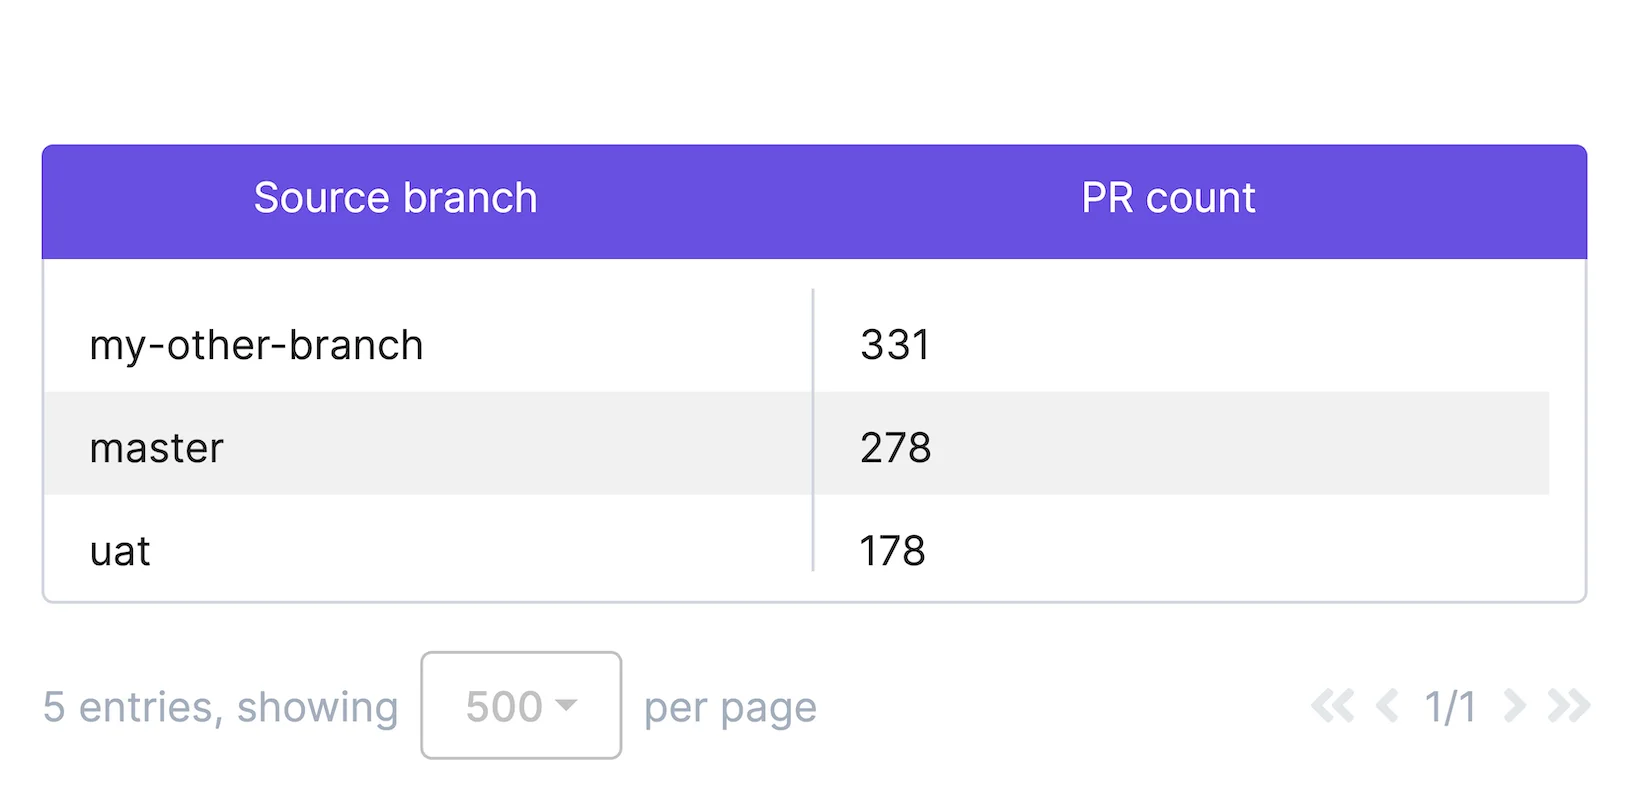
Visualize source branch naming patterns to enforce conventions and keep your repo clean.
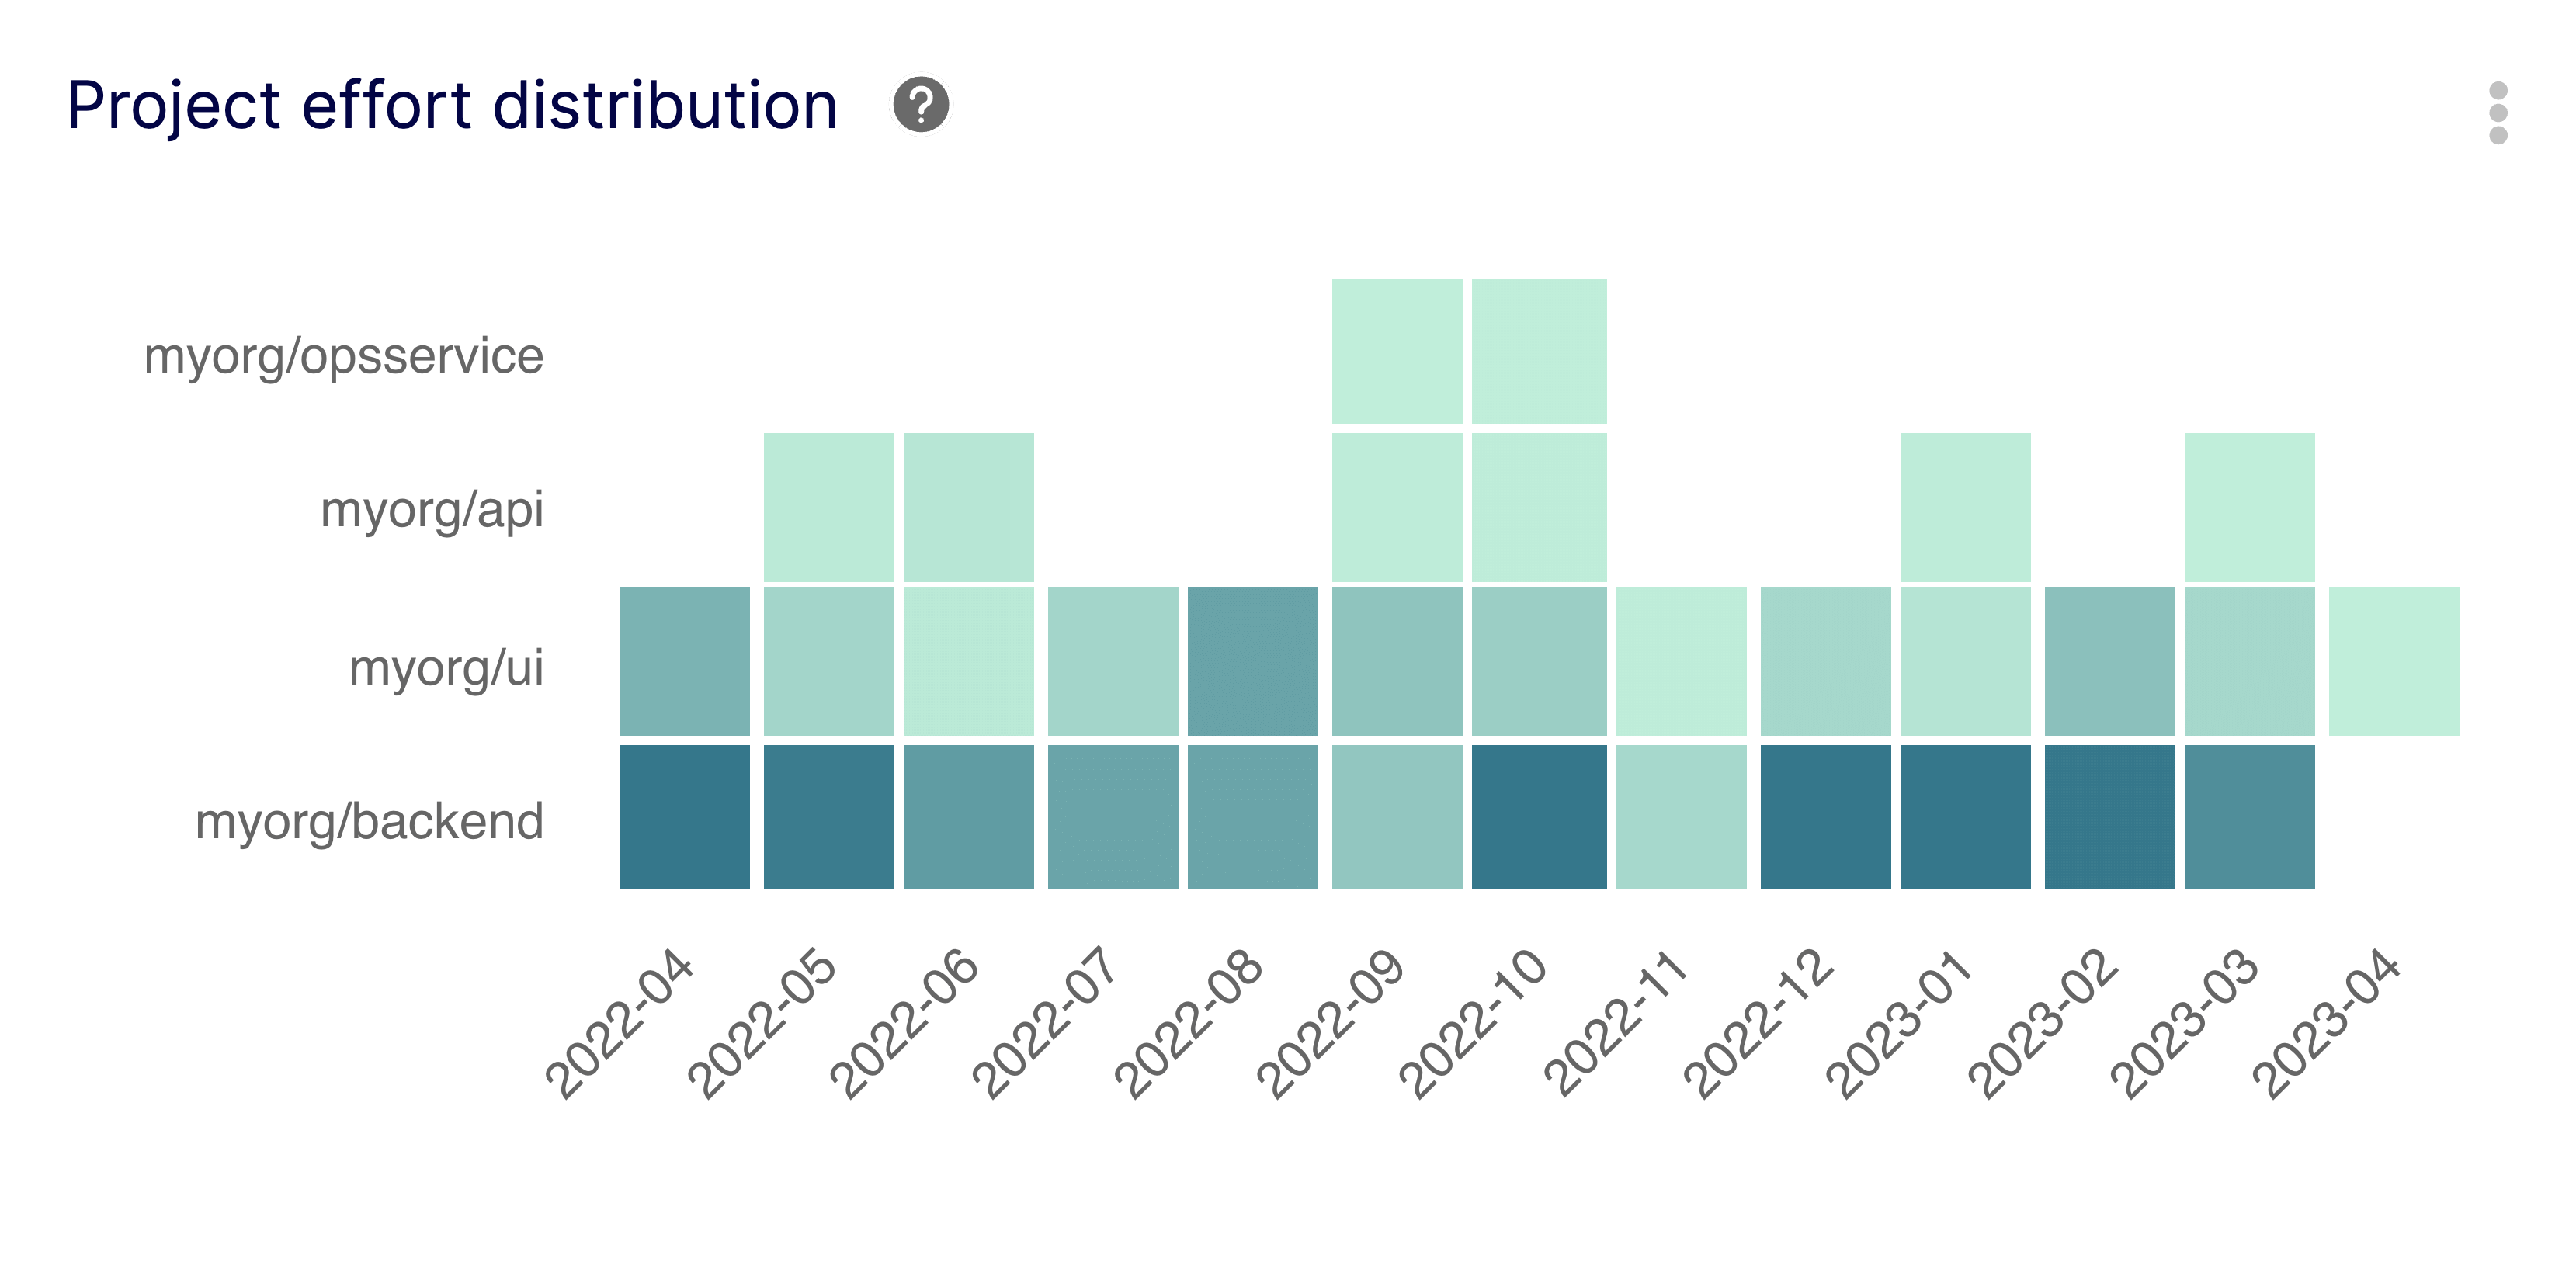
See where your team spends the most time to align development effort with business priorities.
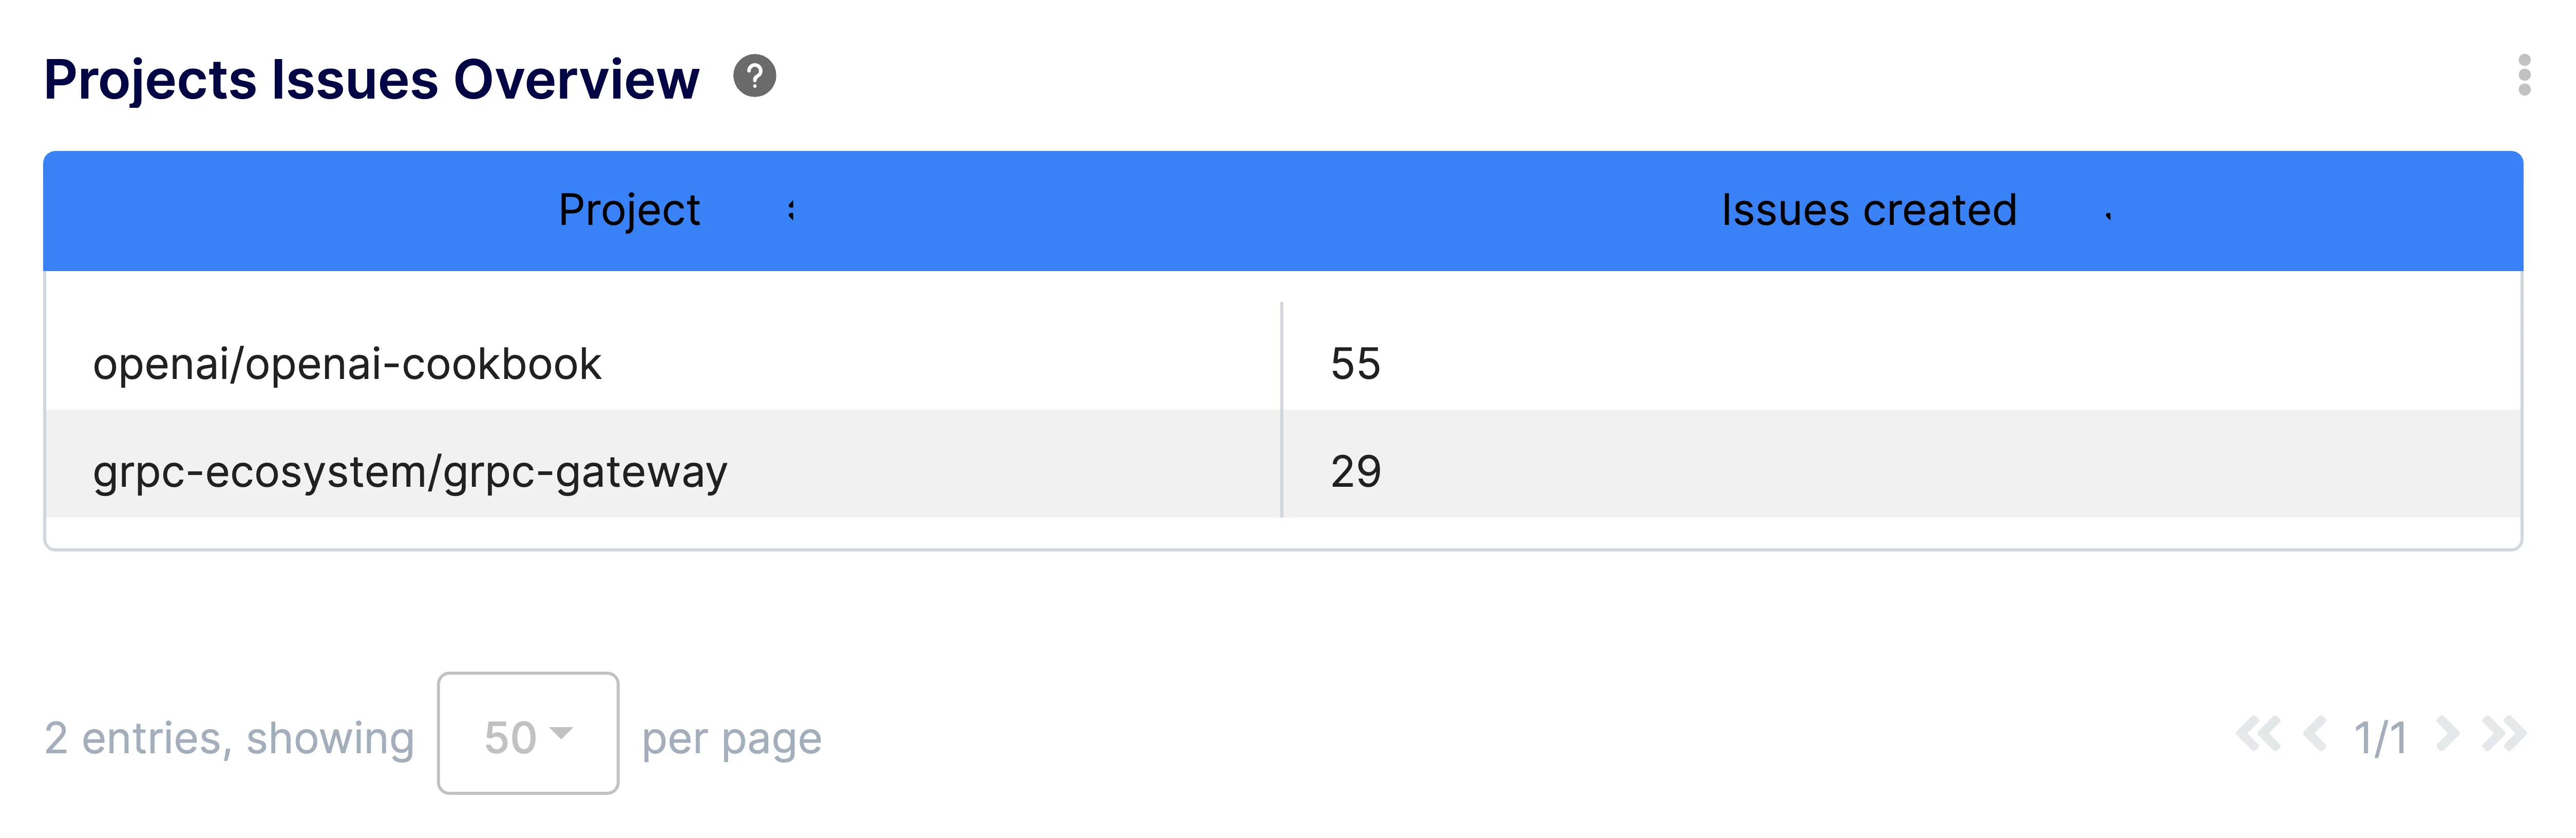
Get a summary of issue status across all projects to identify risks and progress at a glance.
Analyze PR categorization to understand the types of changes being merged.
Access detailed PR data to build custom reports on development velocity and quality.
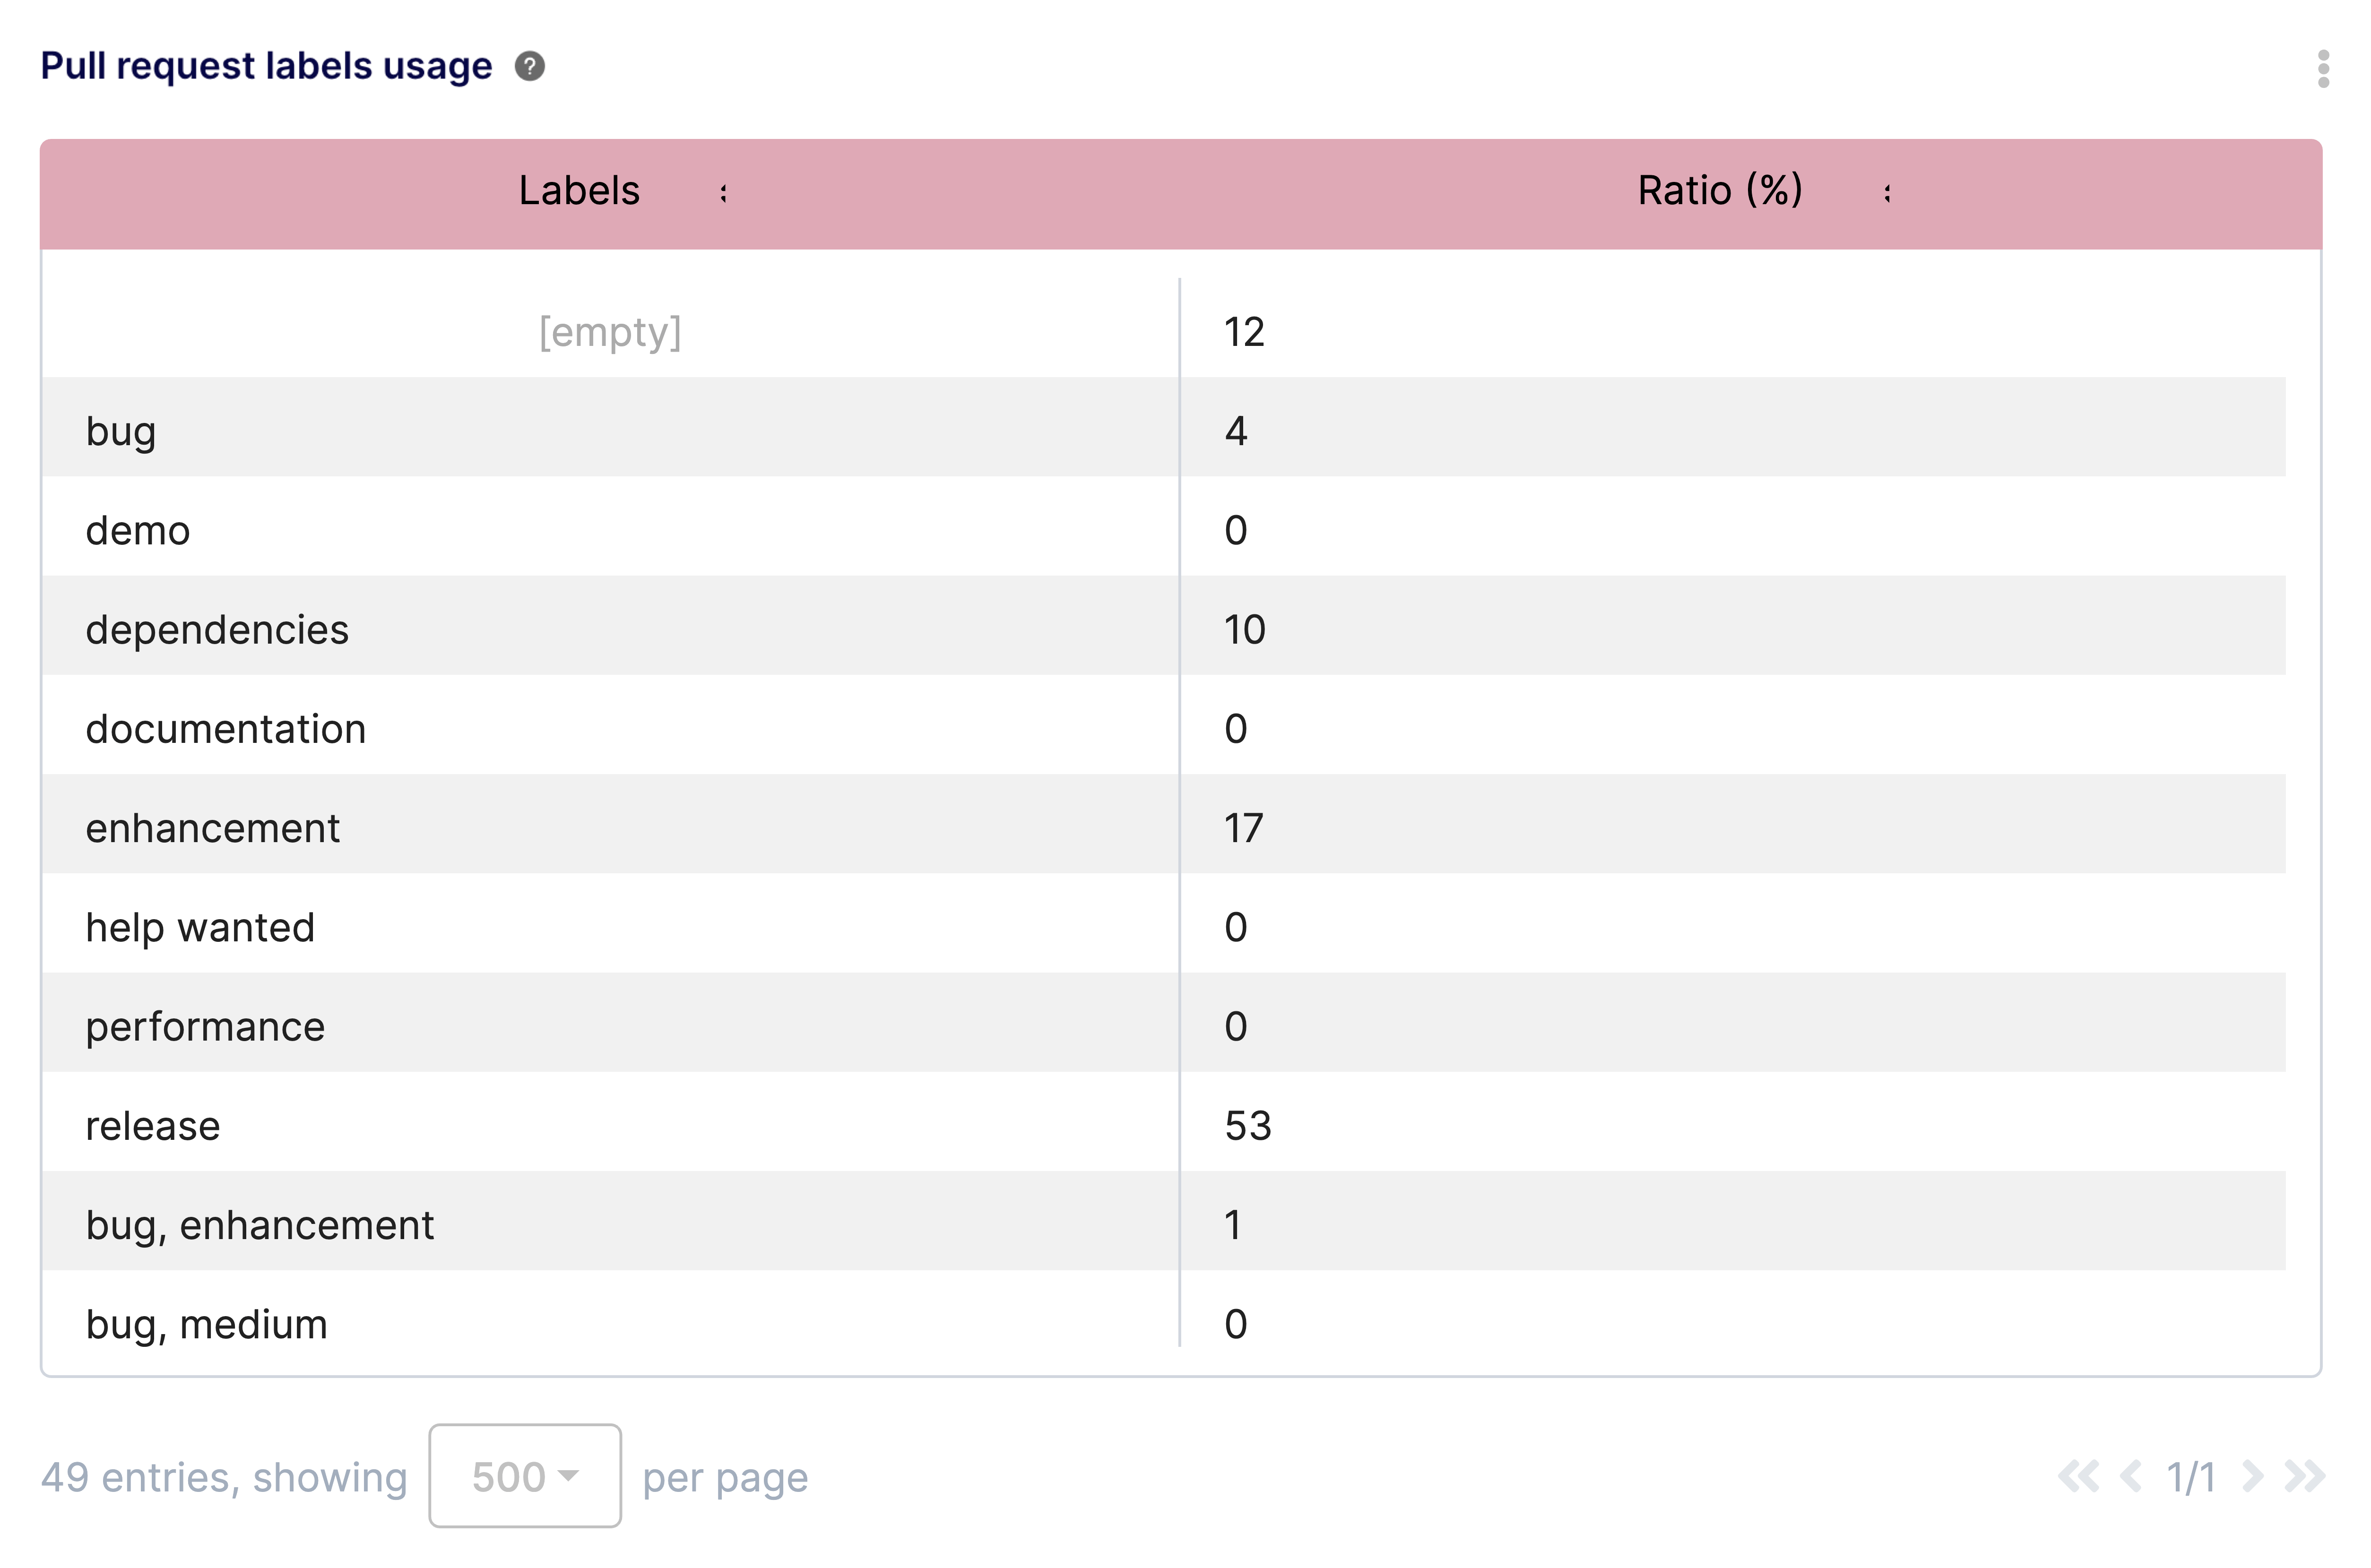
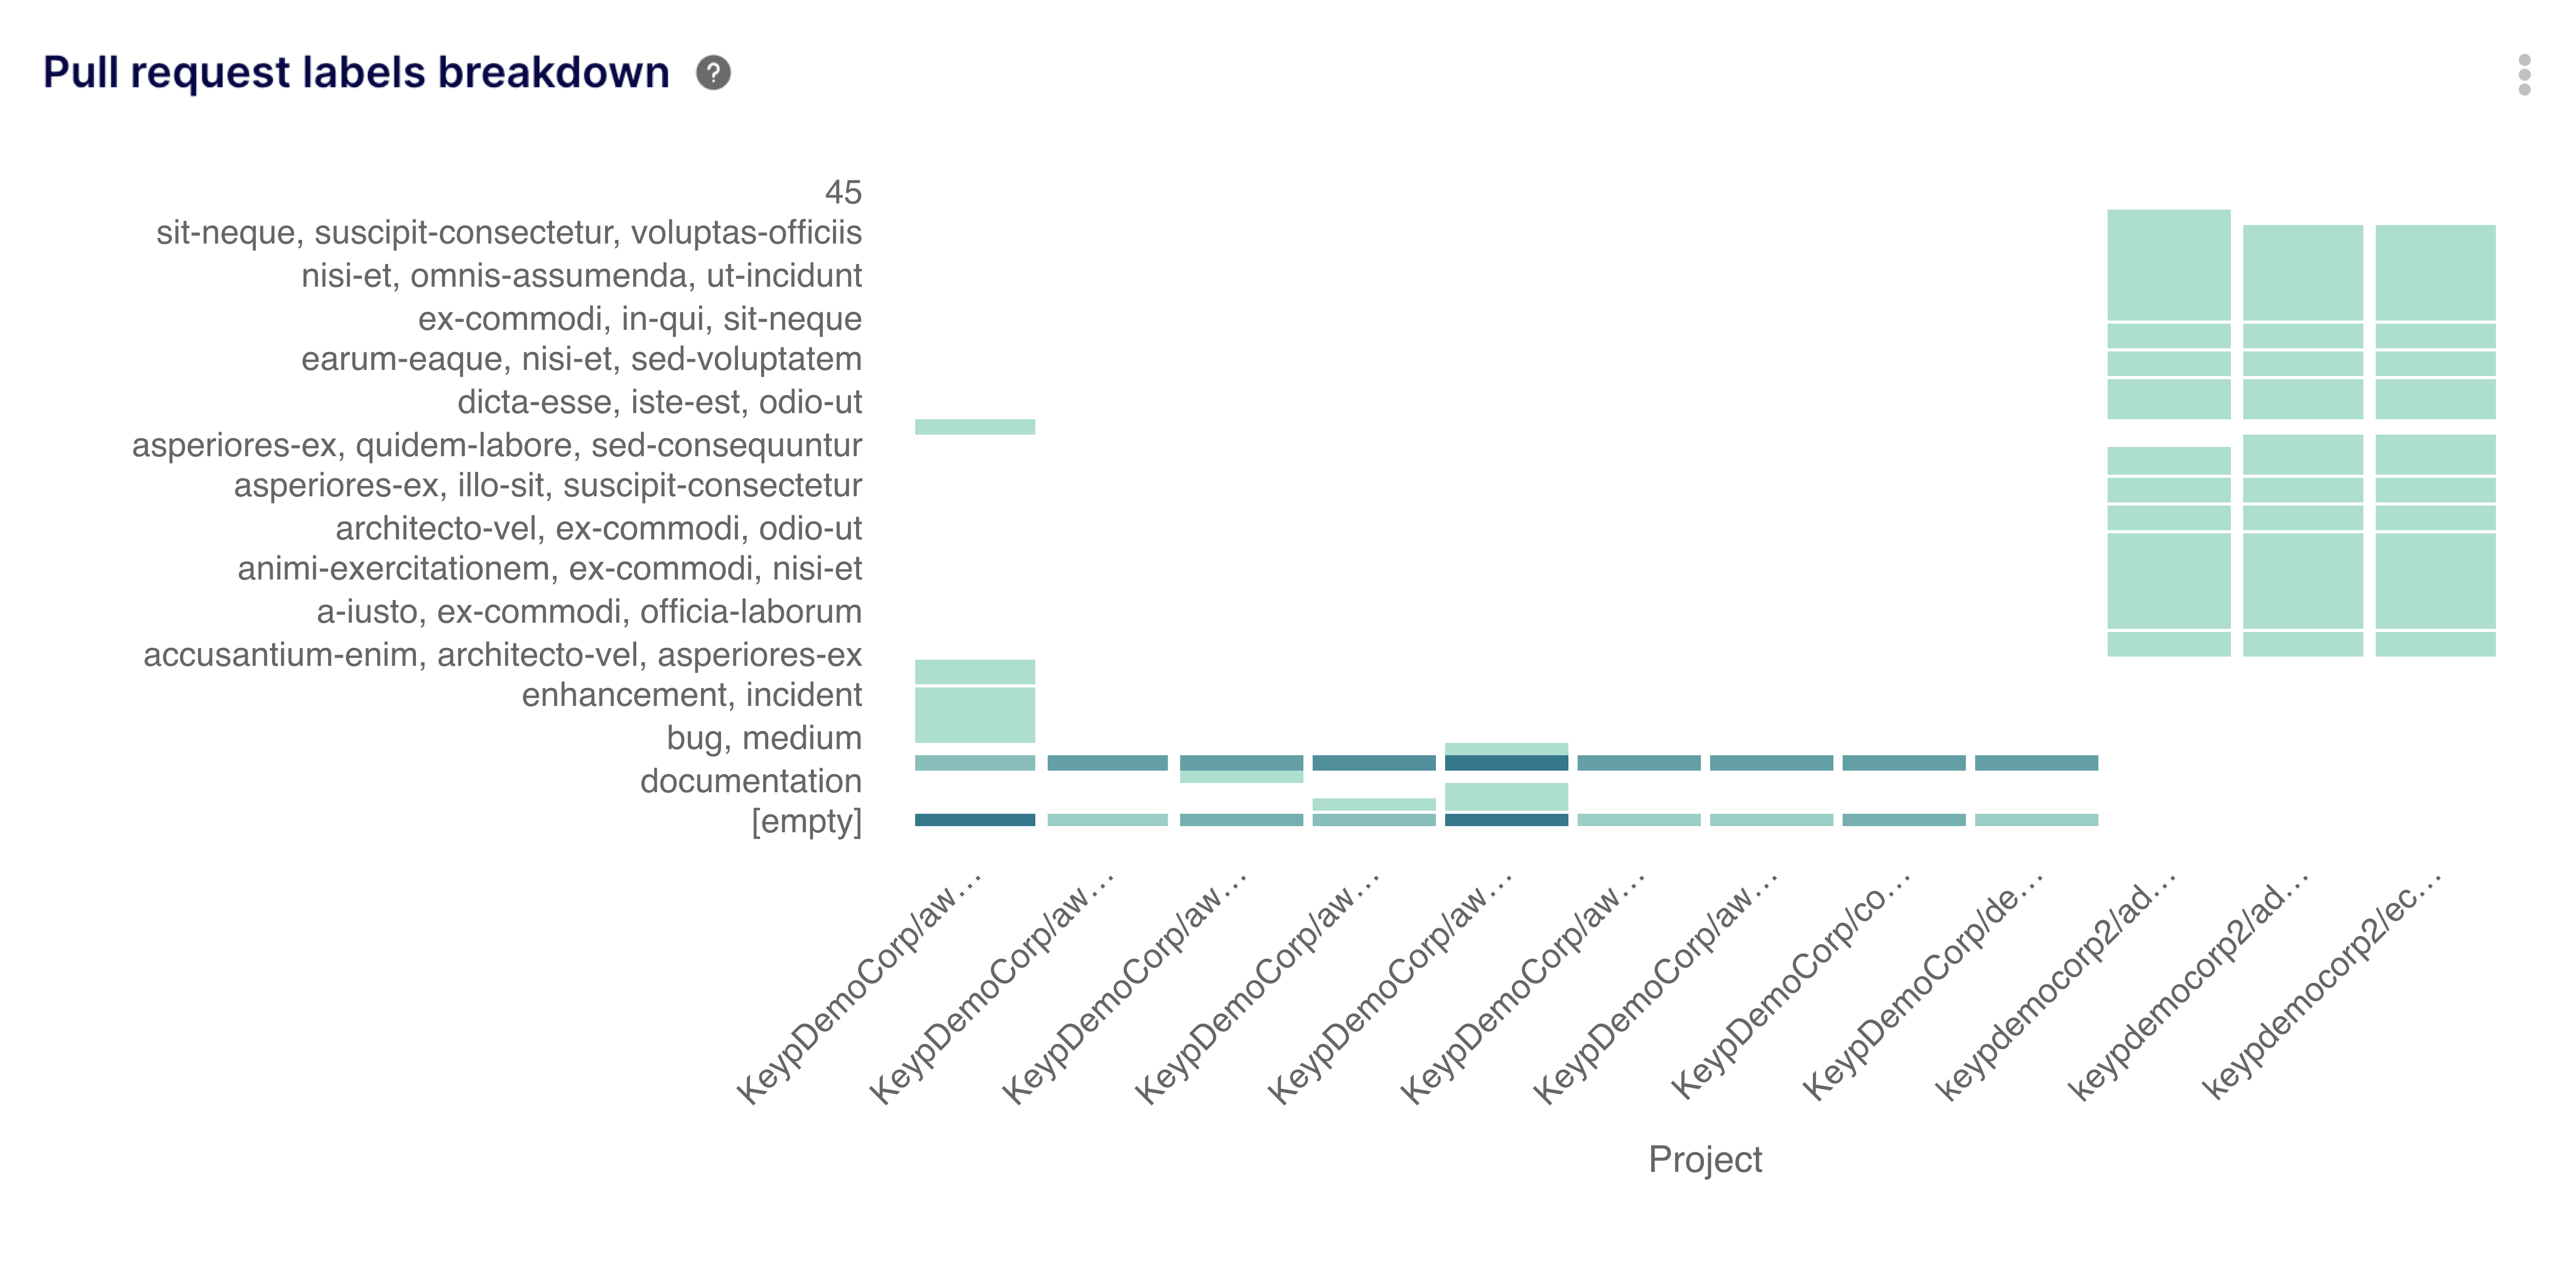
Review all labels used on pull requests to ensure consistency and proper categorization.
Get a prioritized list of items requiring immediate attention to unblock your workflow.
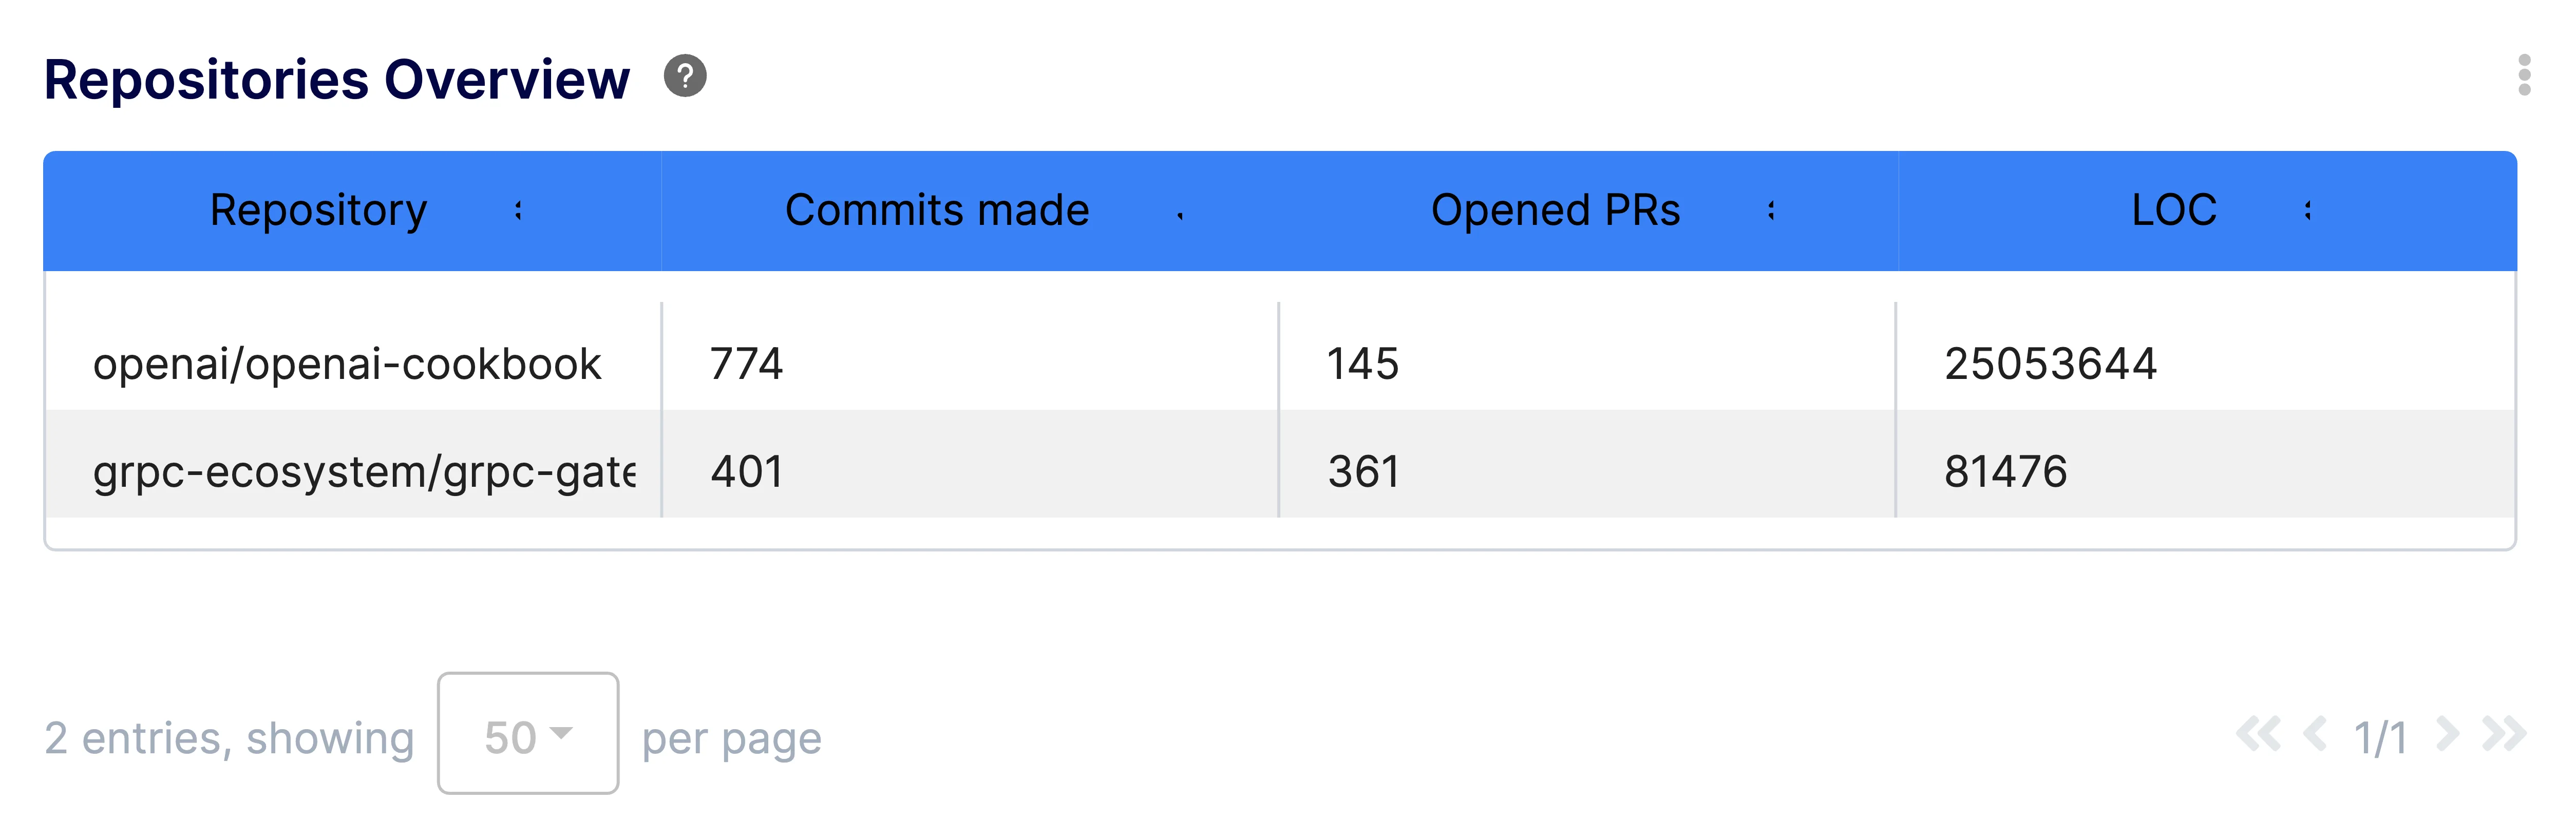
View activity metrics across all repositories to spot active projects and dormant codebases.
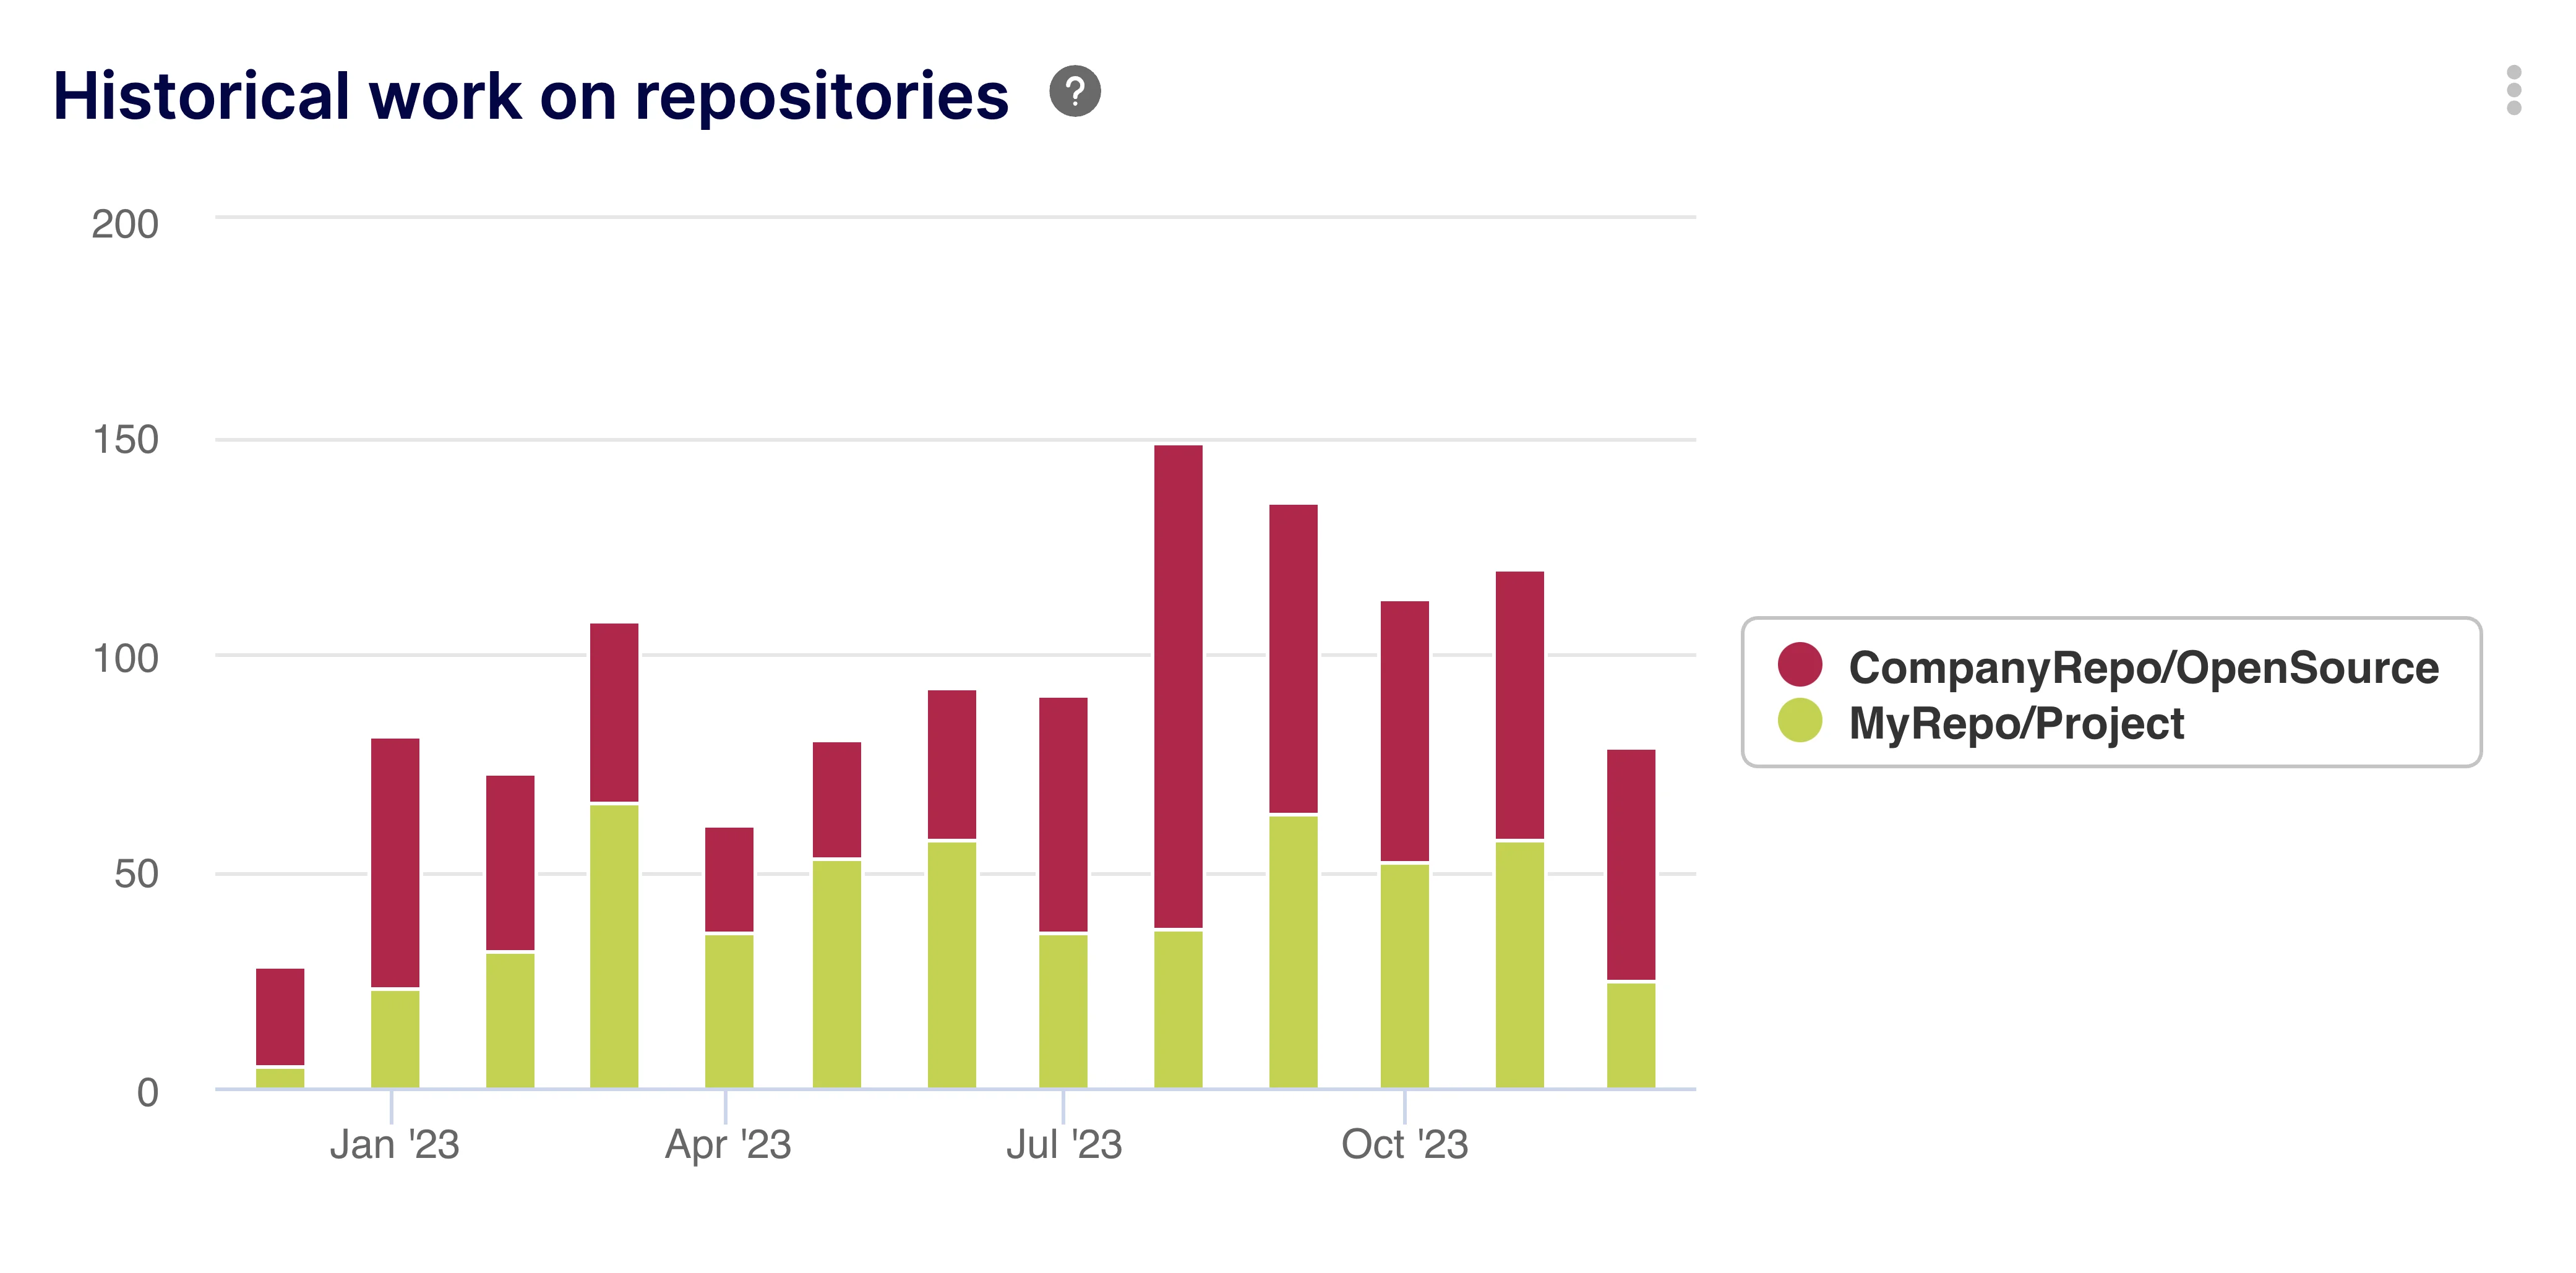
Track commits and PR trends over time to visualize development cadence per repository.
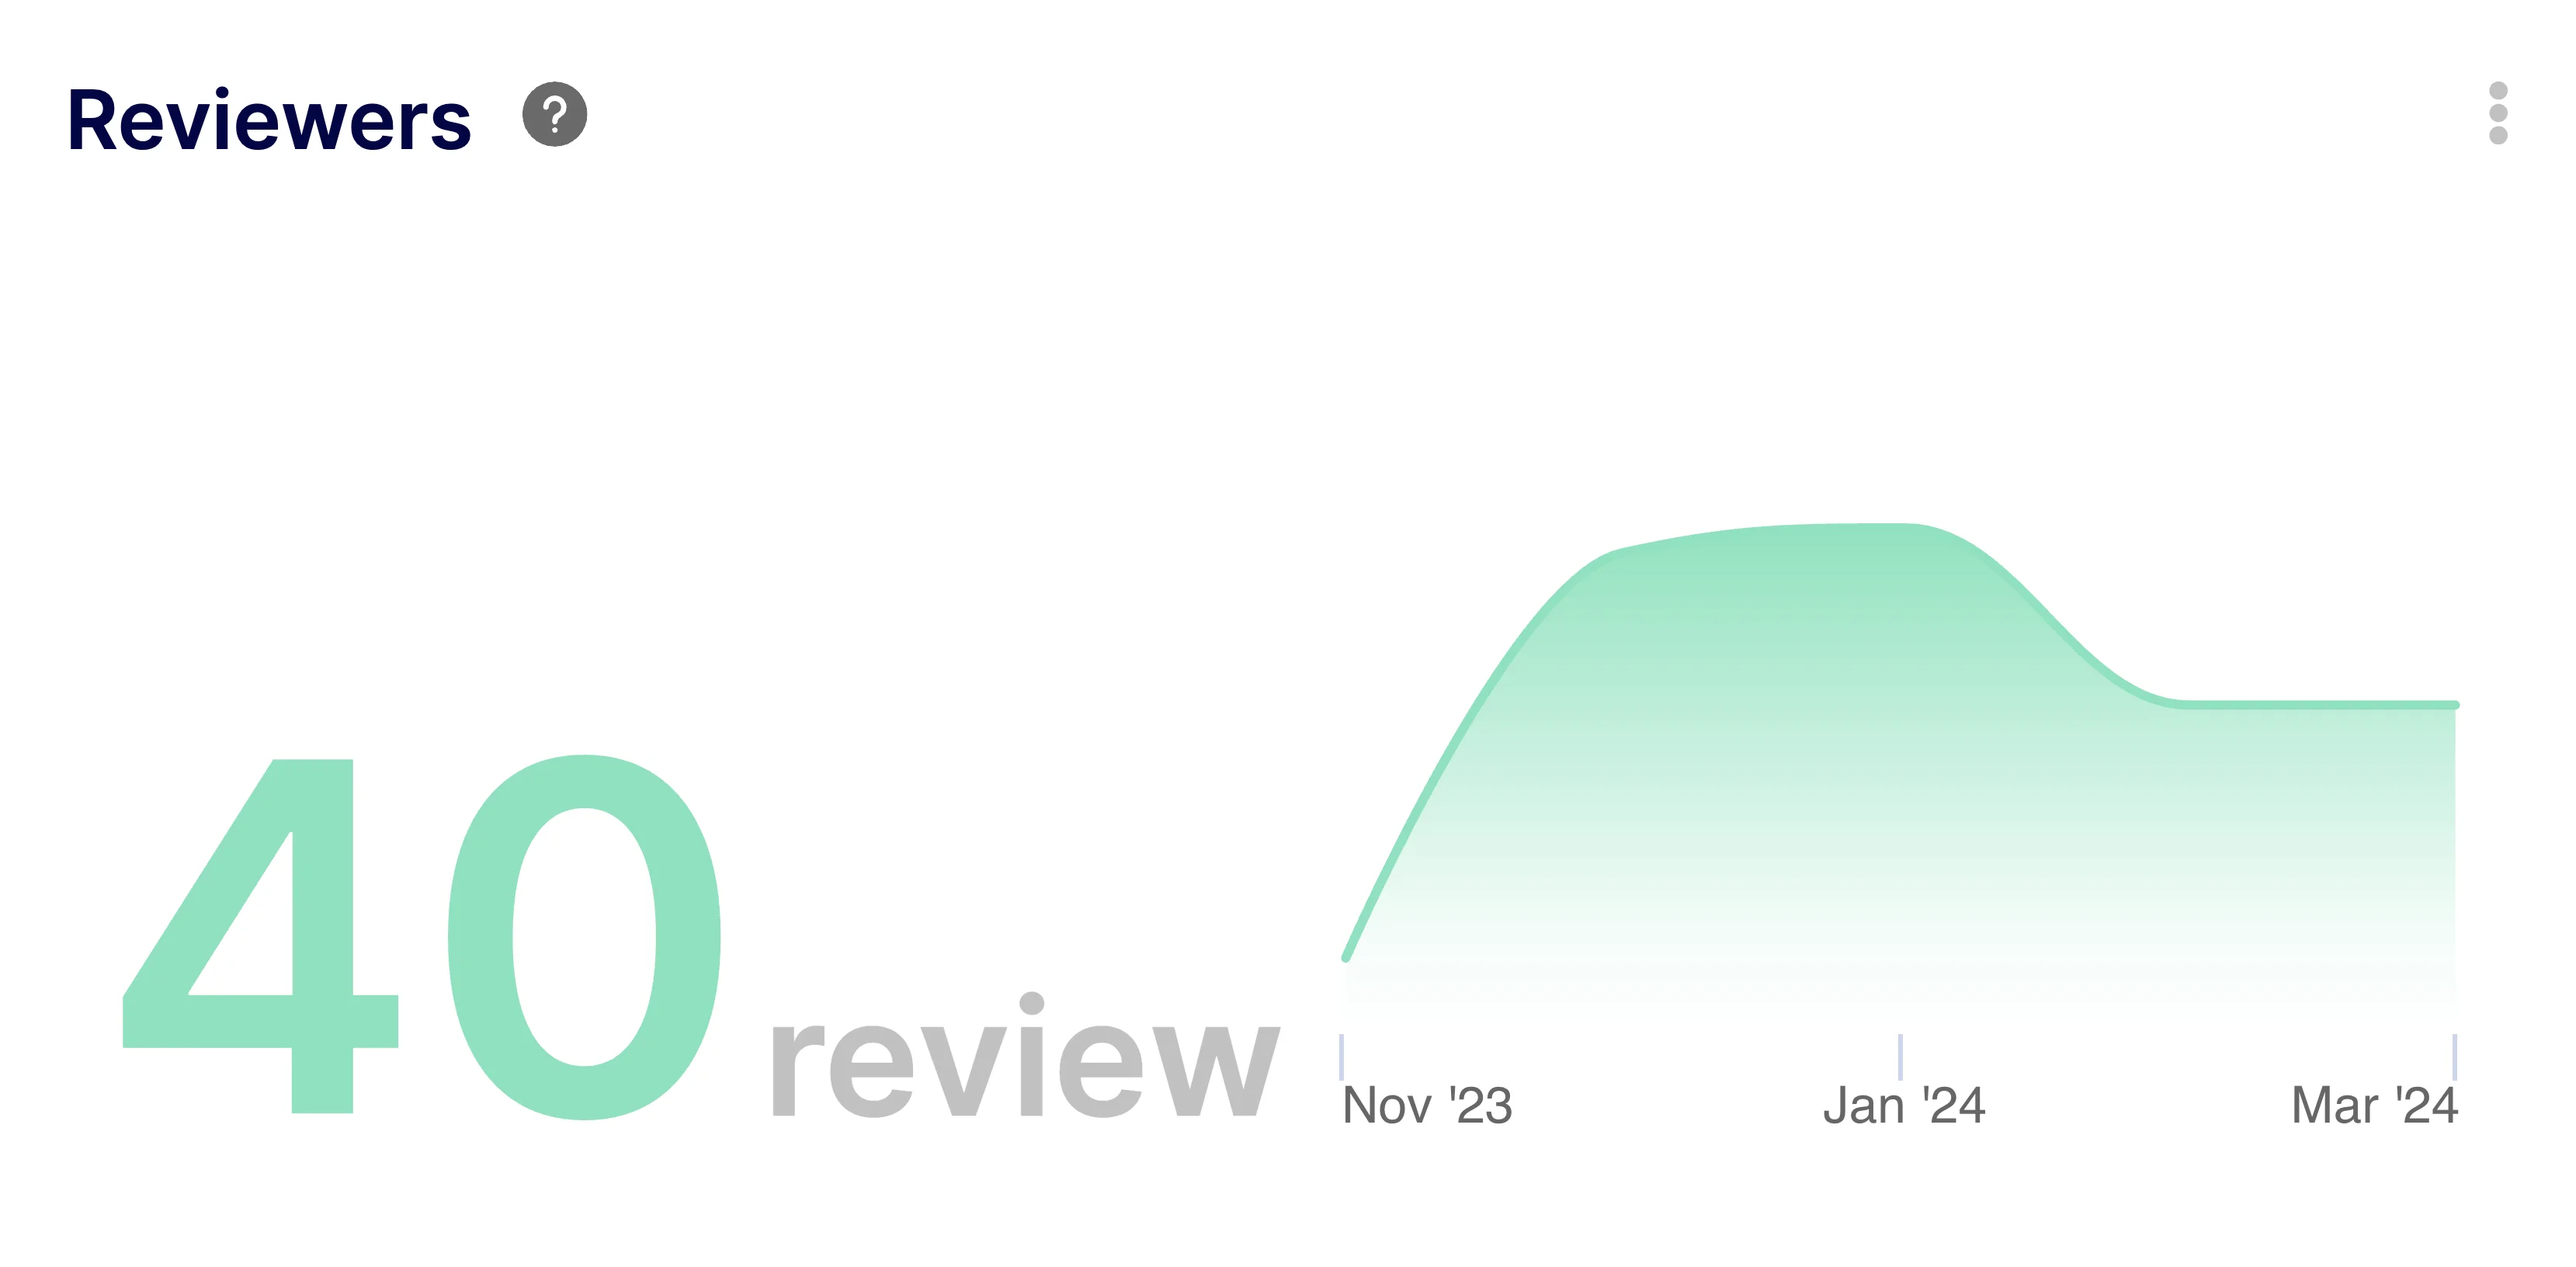
Identify top reviewers and potential bottlenecks to improve code review distribution.
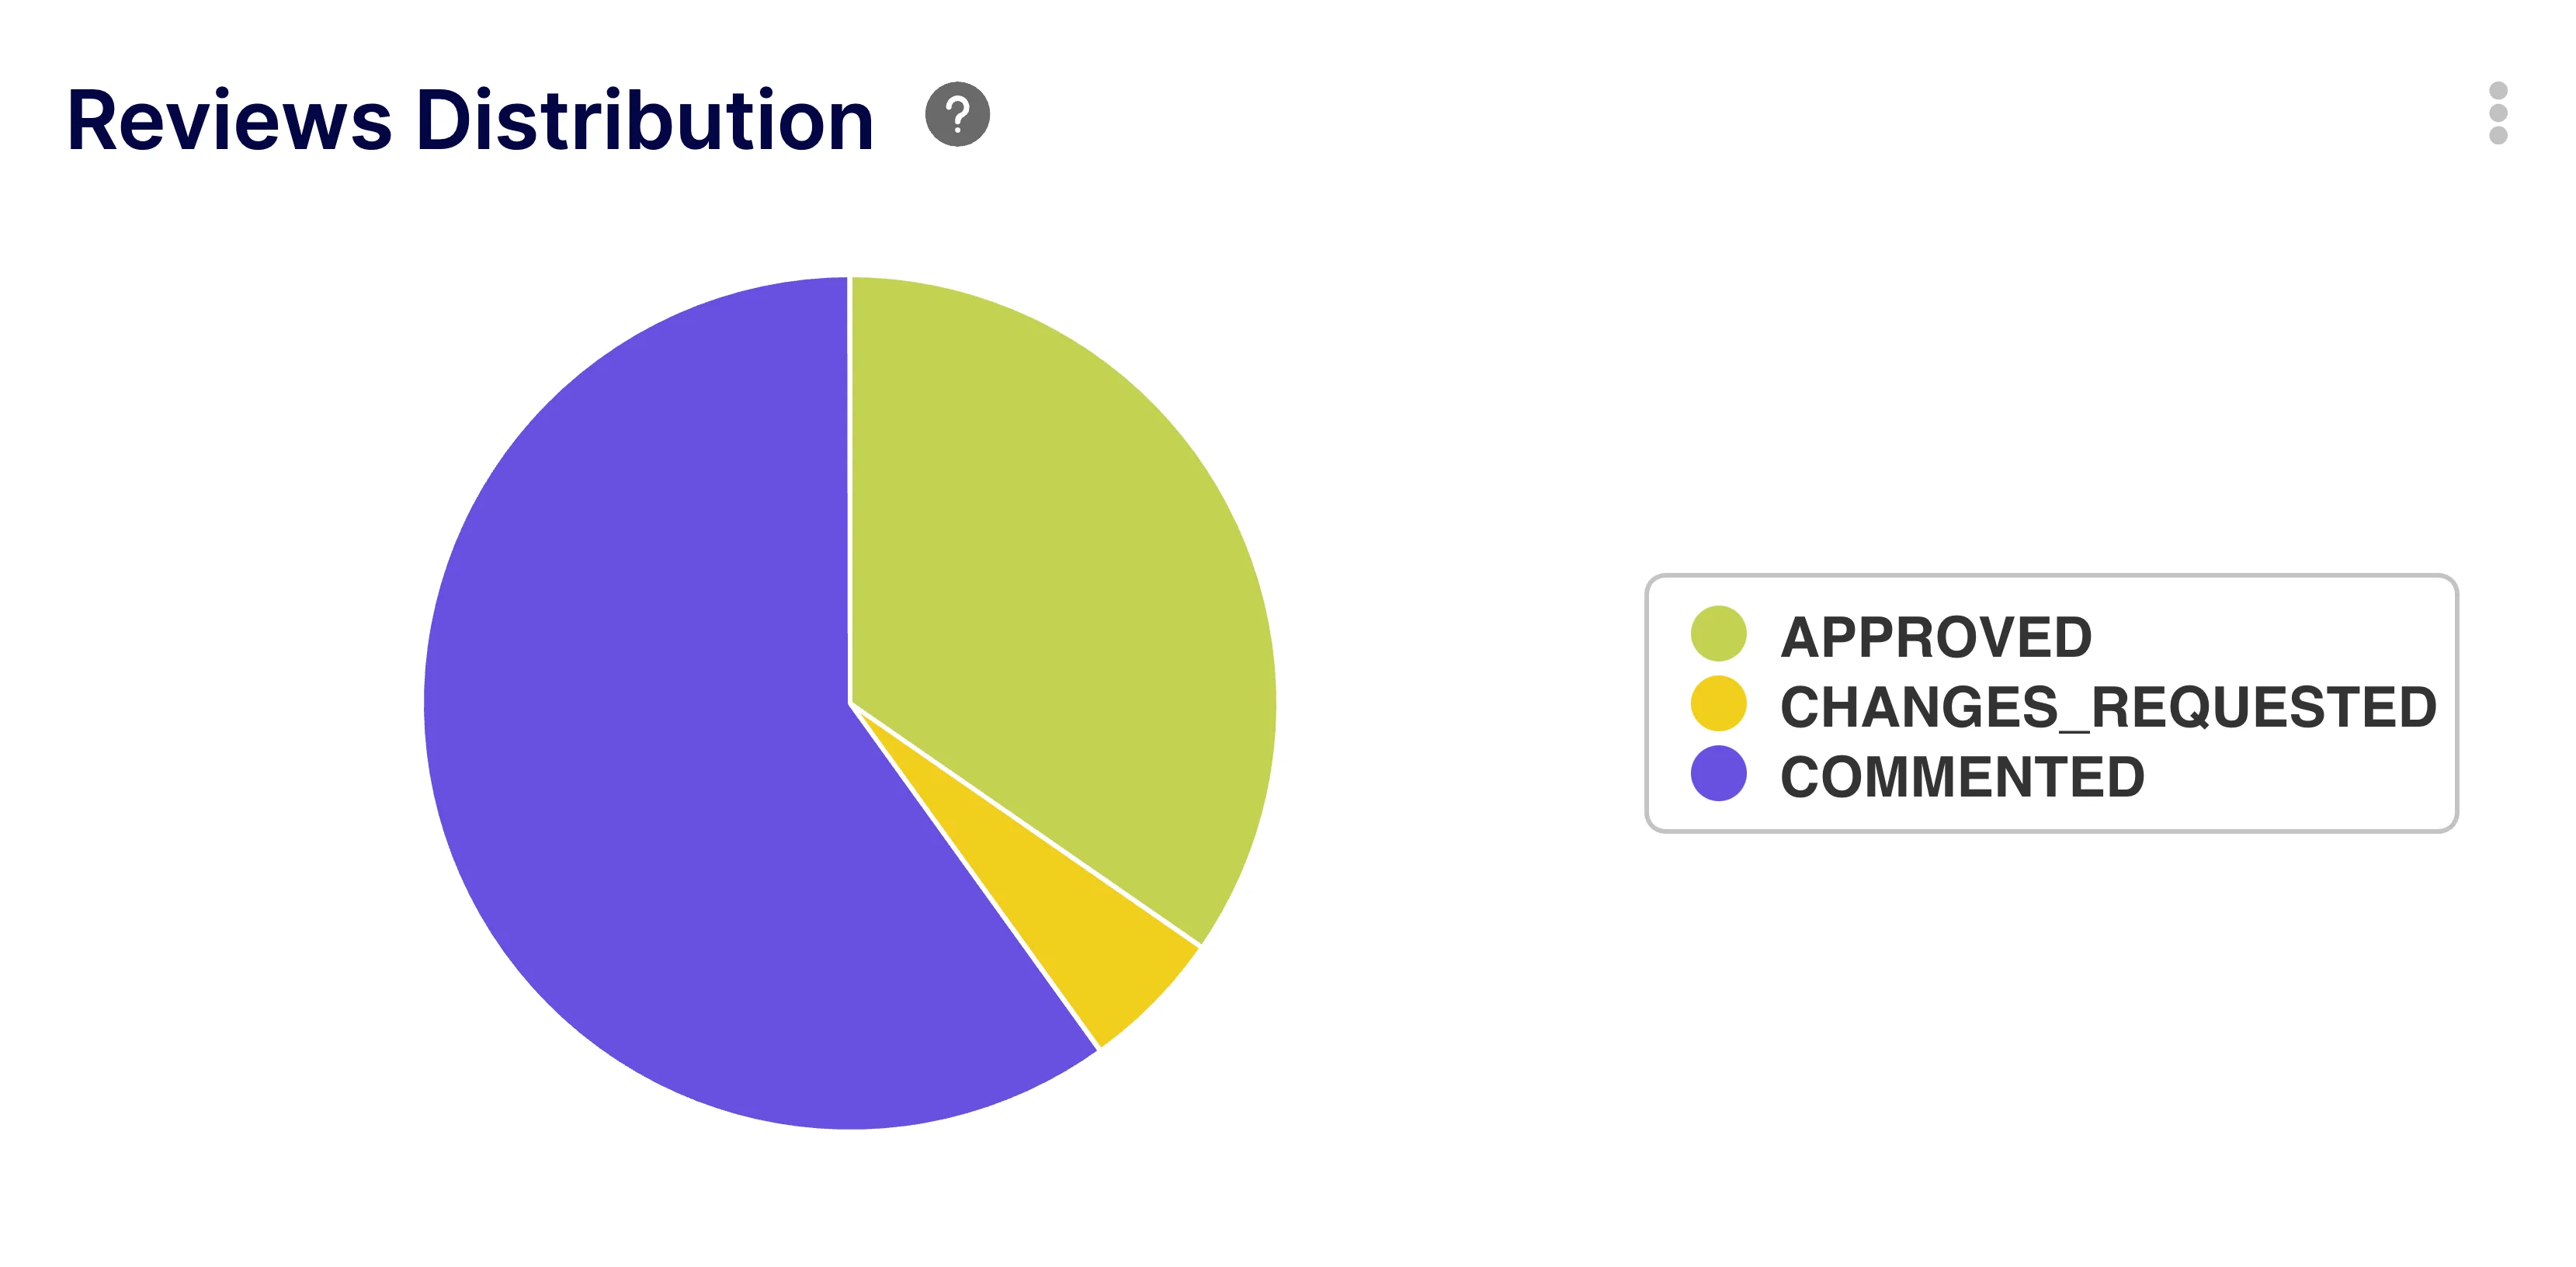
Visualize review outcomes (approved, changes requested) to assess code quality trends.
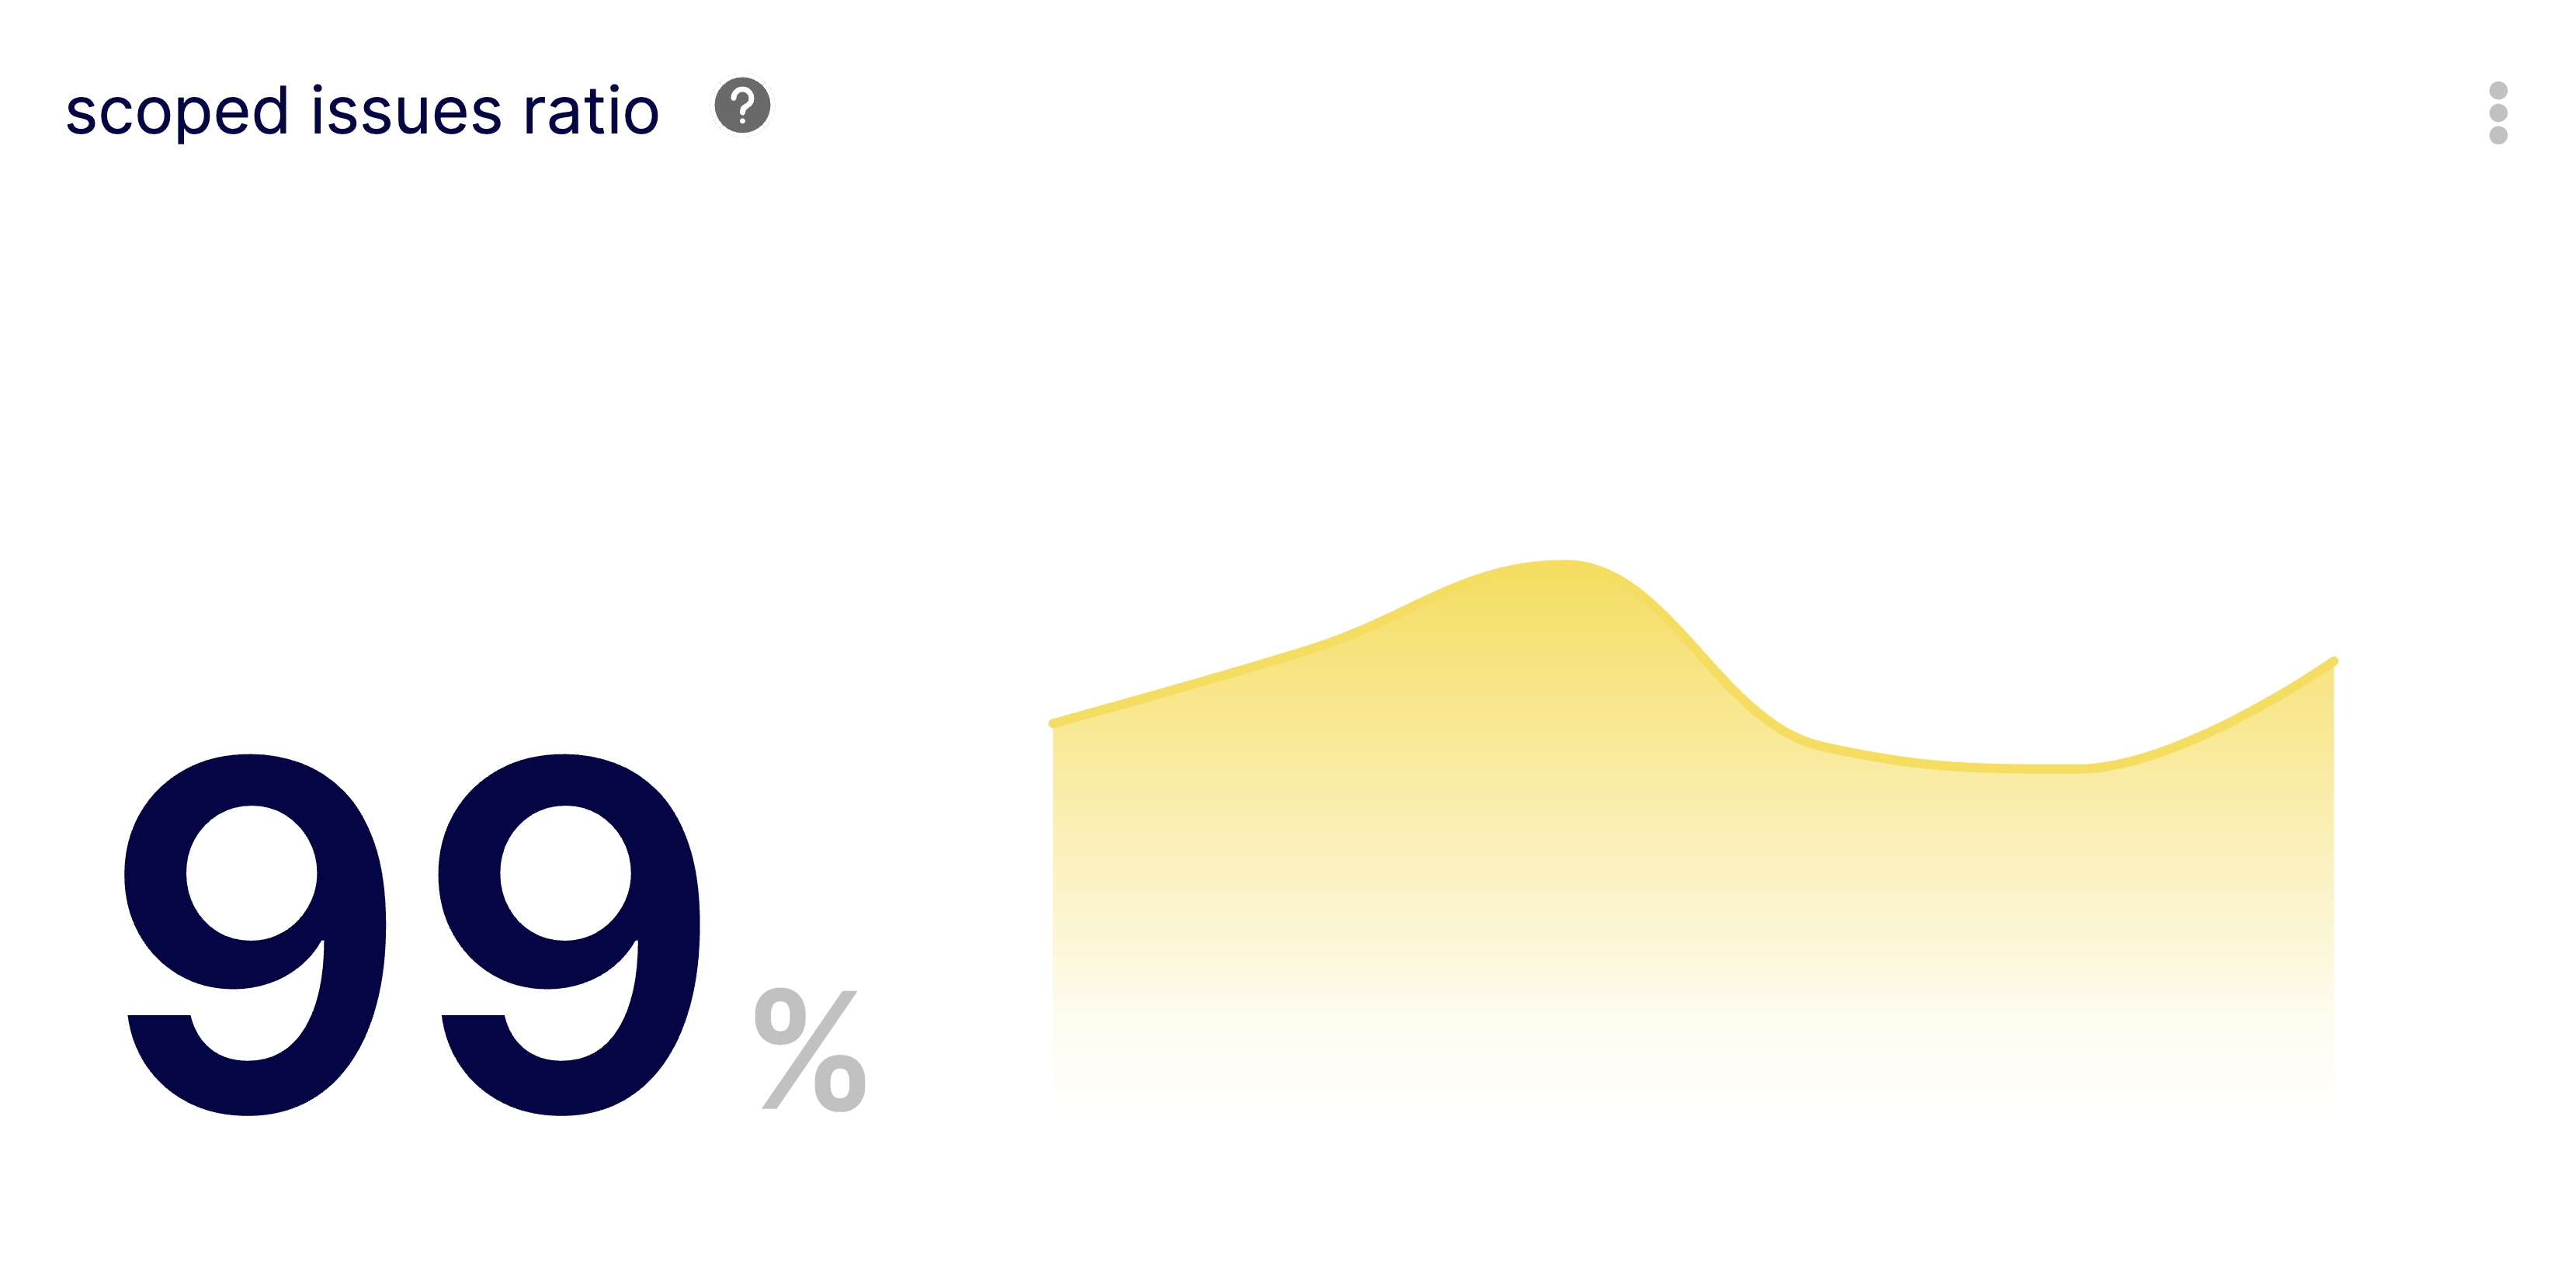
Check the ratio of fully scoped issues to ensuring the backlog is ready for development.
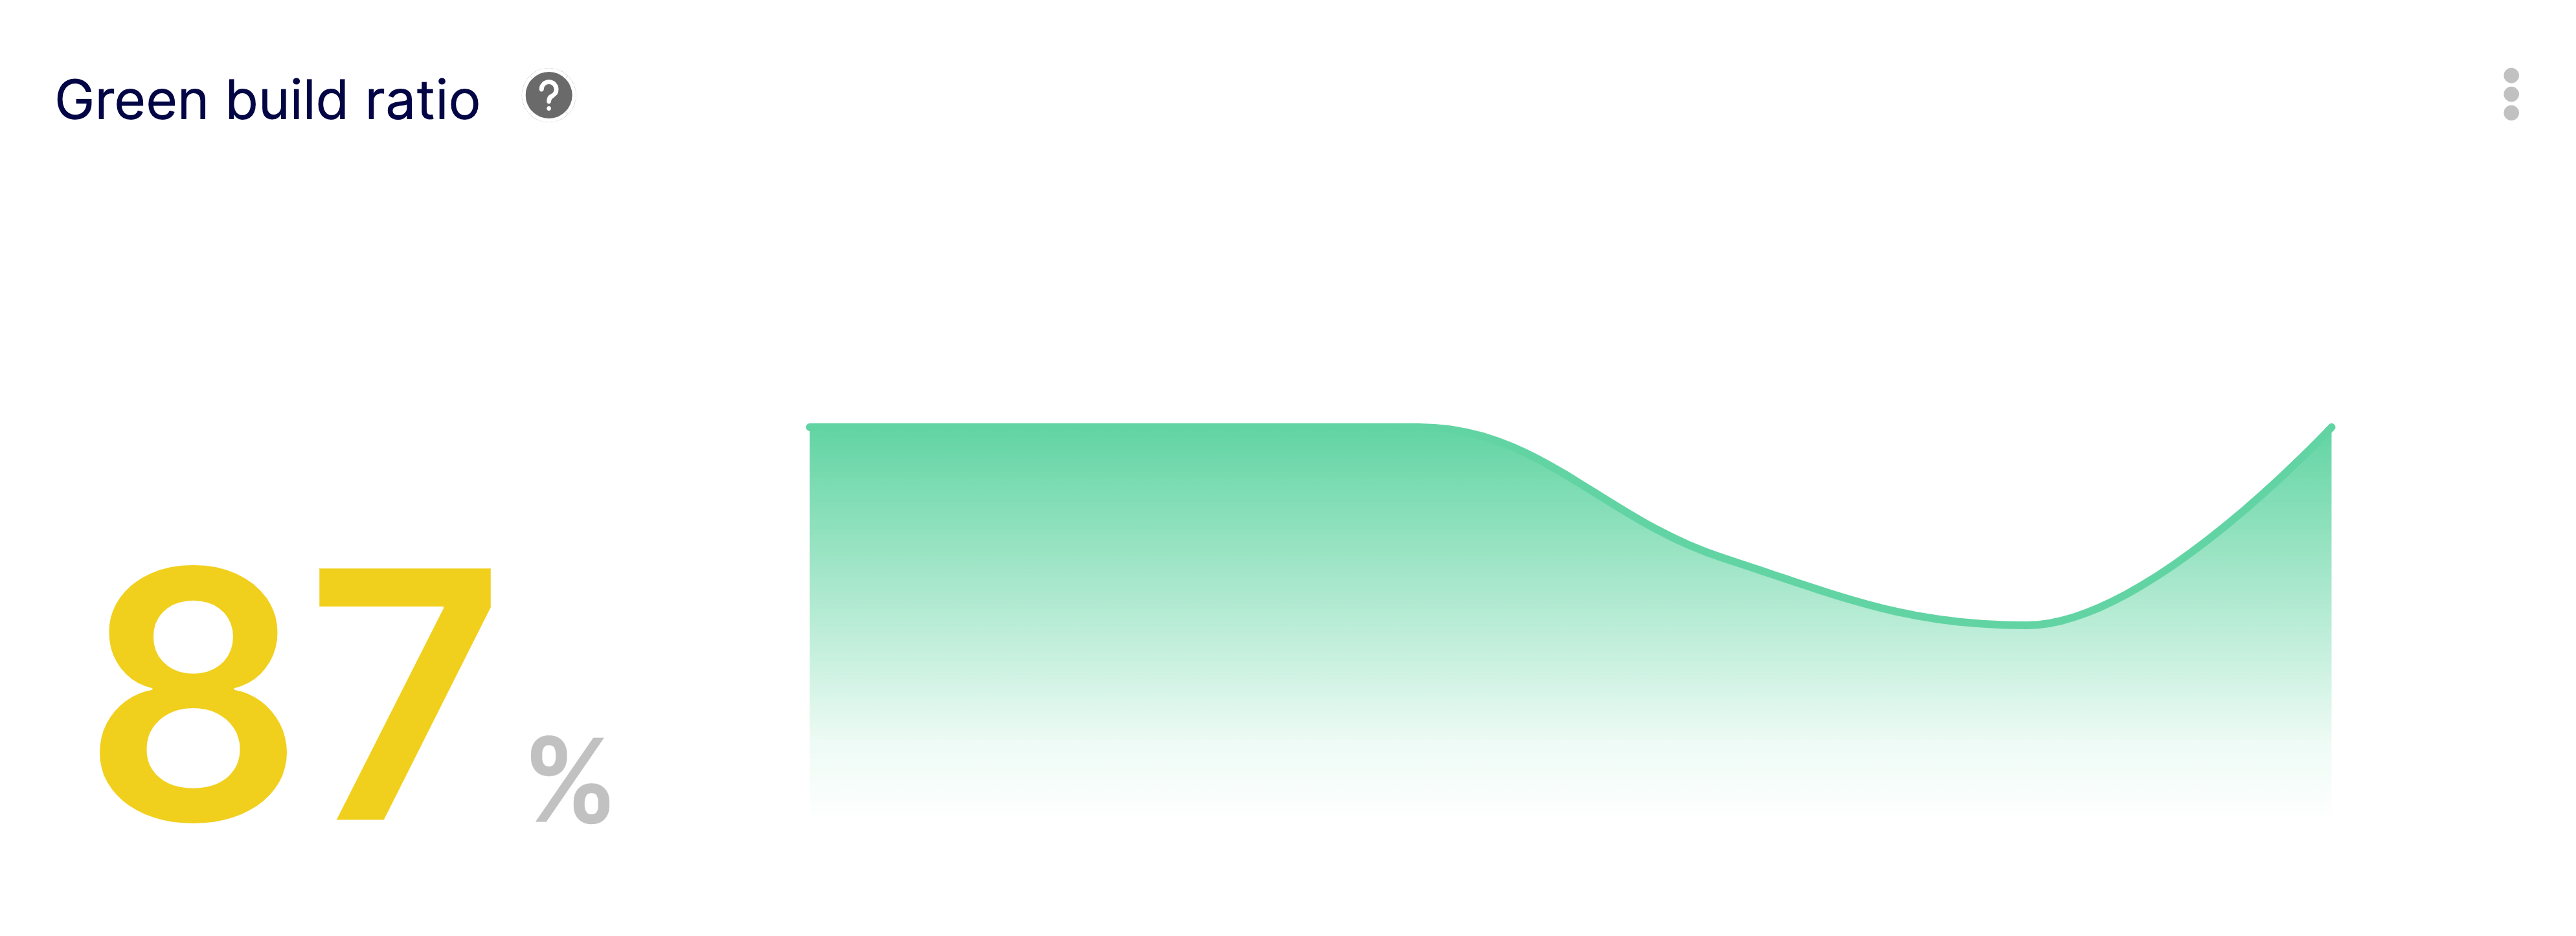
Monitor build success rates for compliance auditing and continuous integration health.
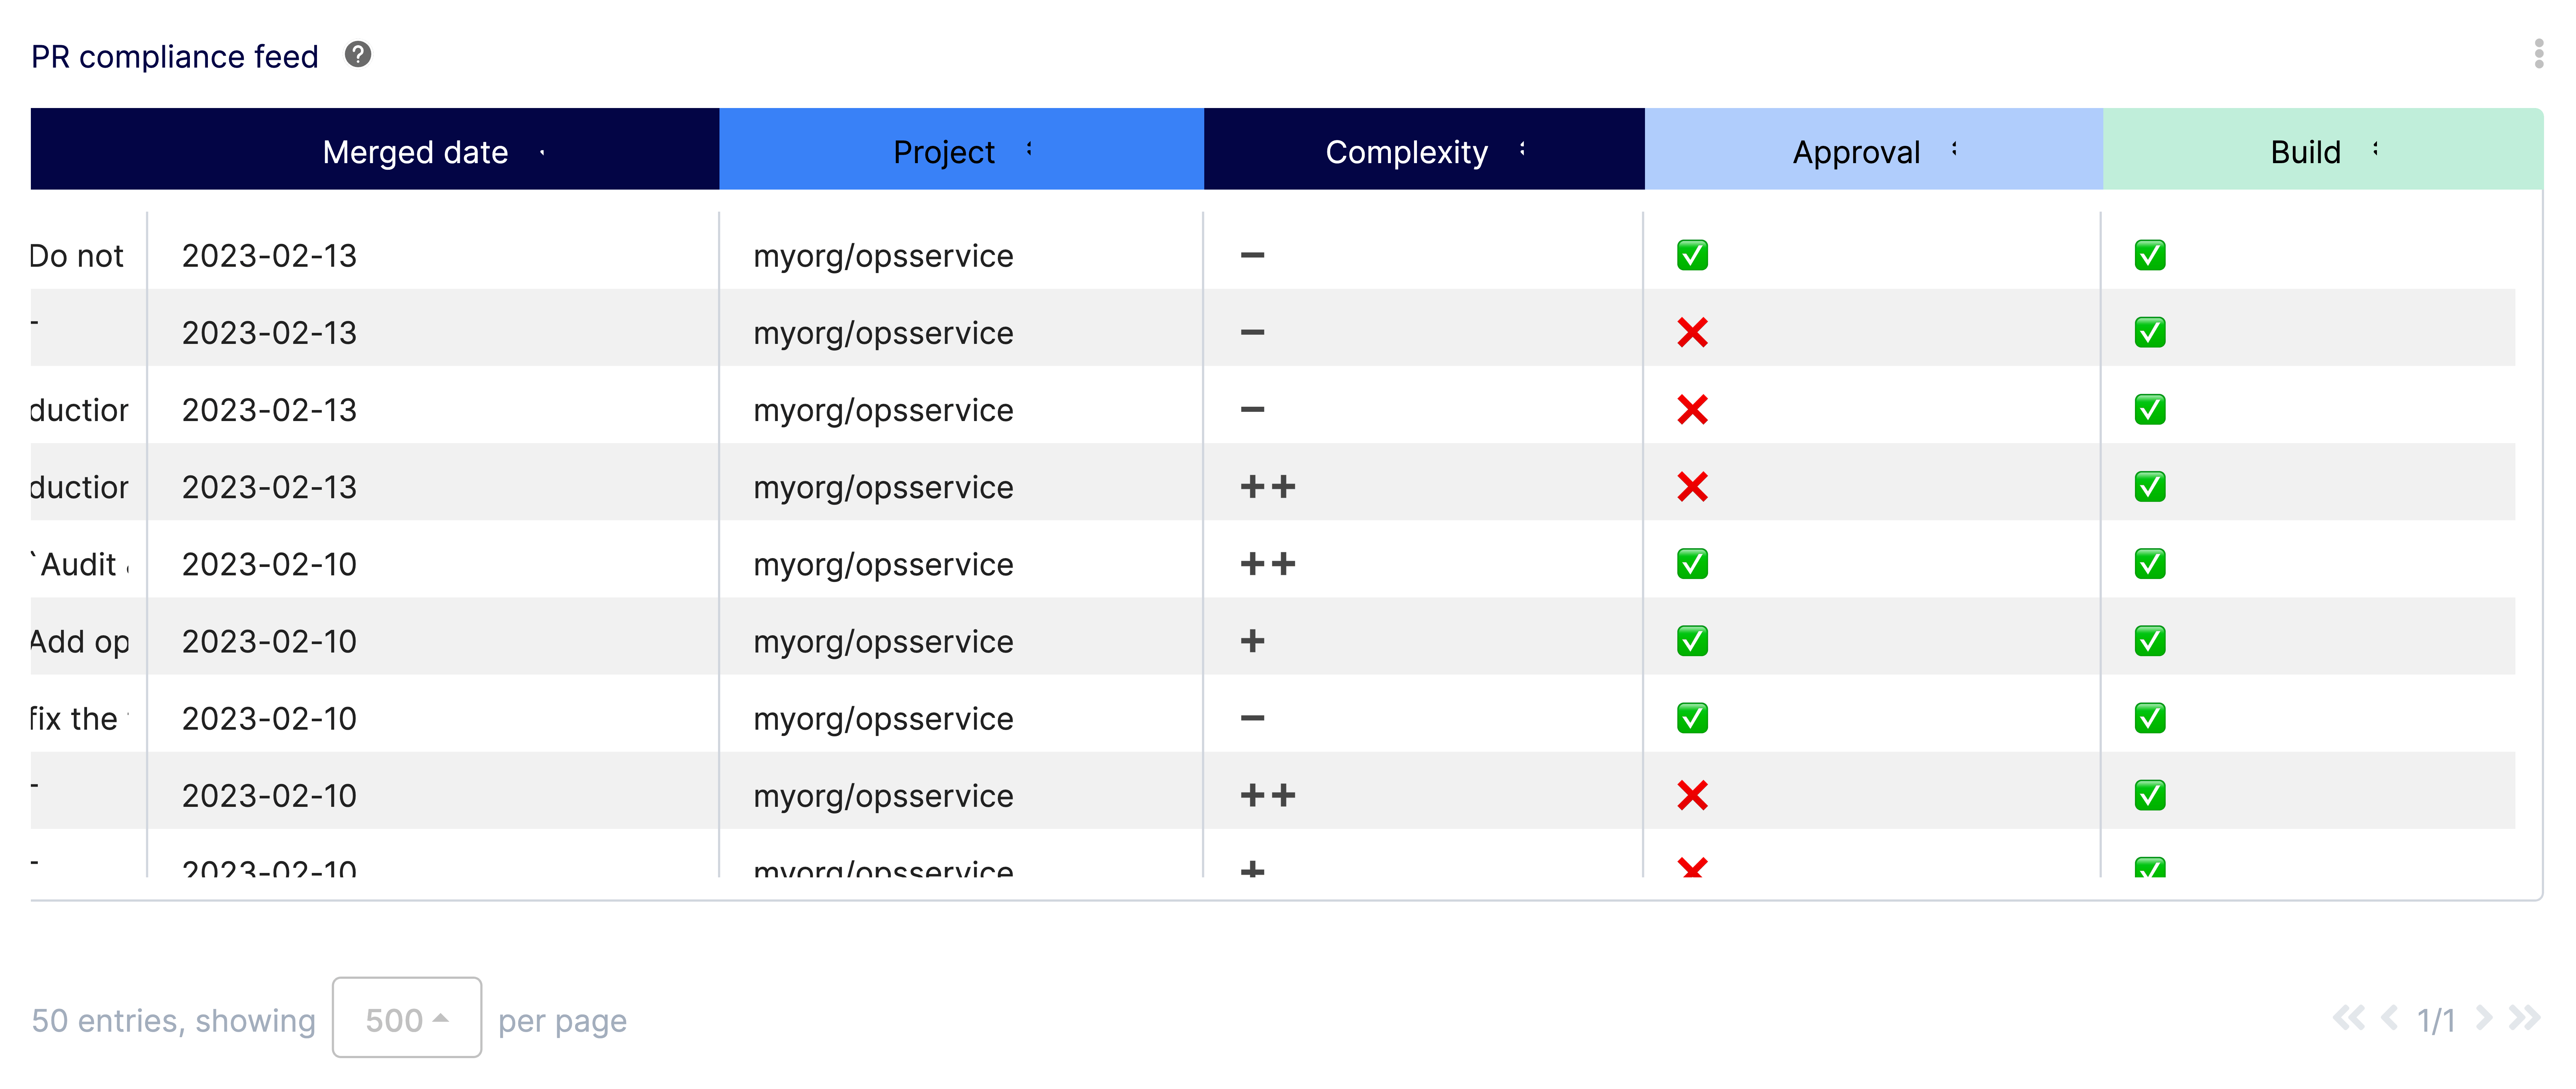
Generate a compliance report of all merged PRs verifying approvals and build checks.
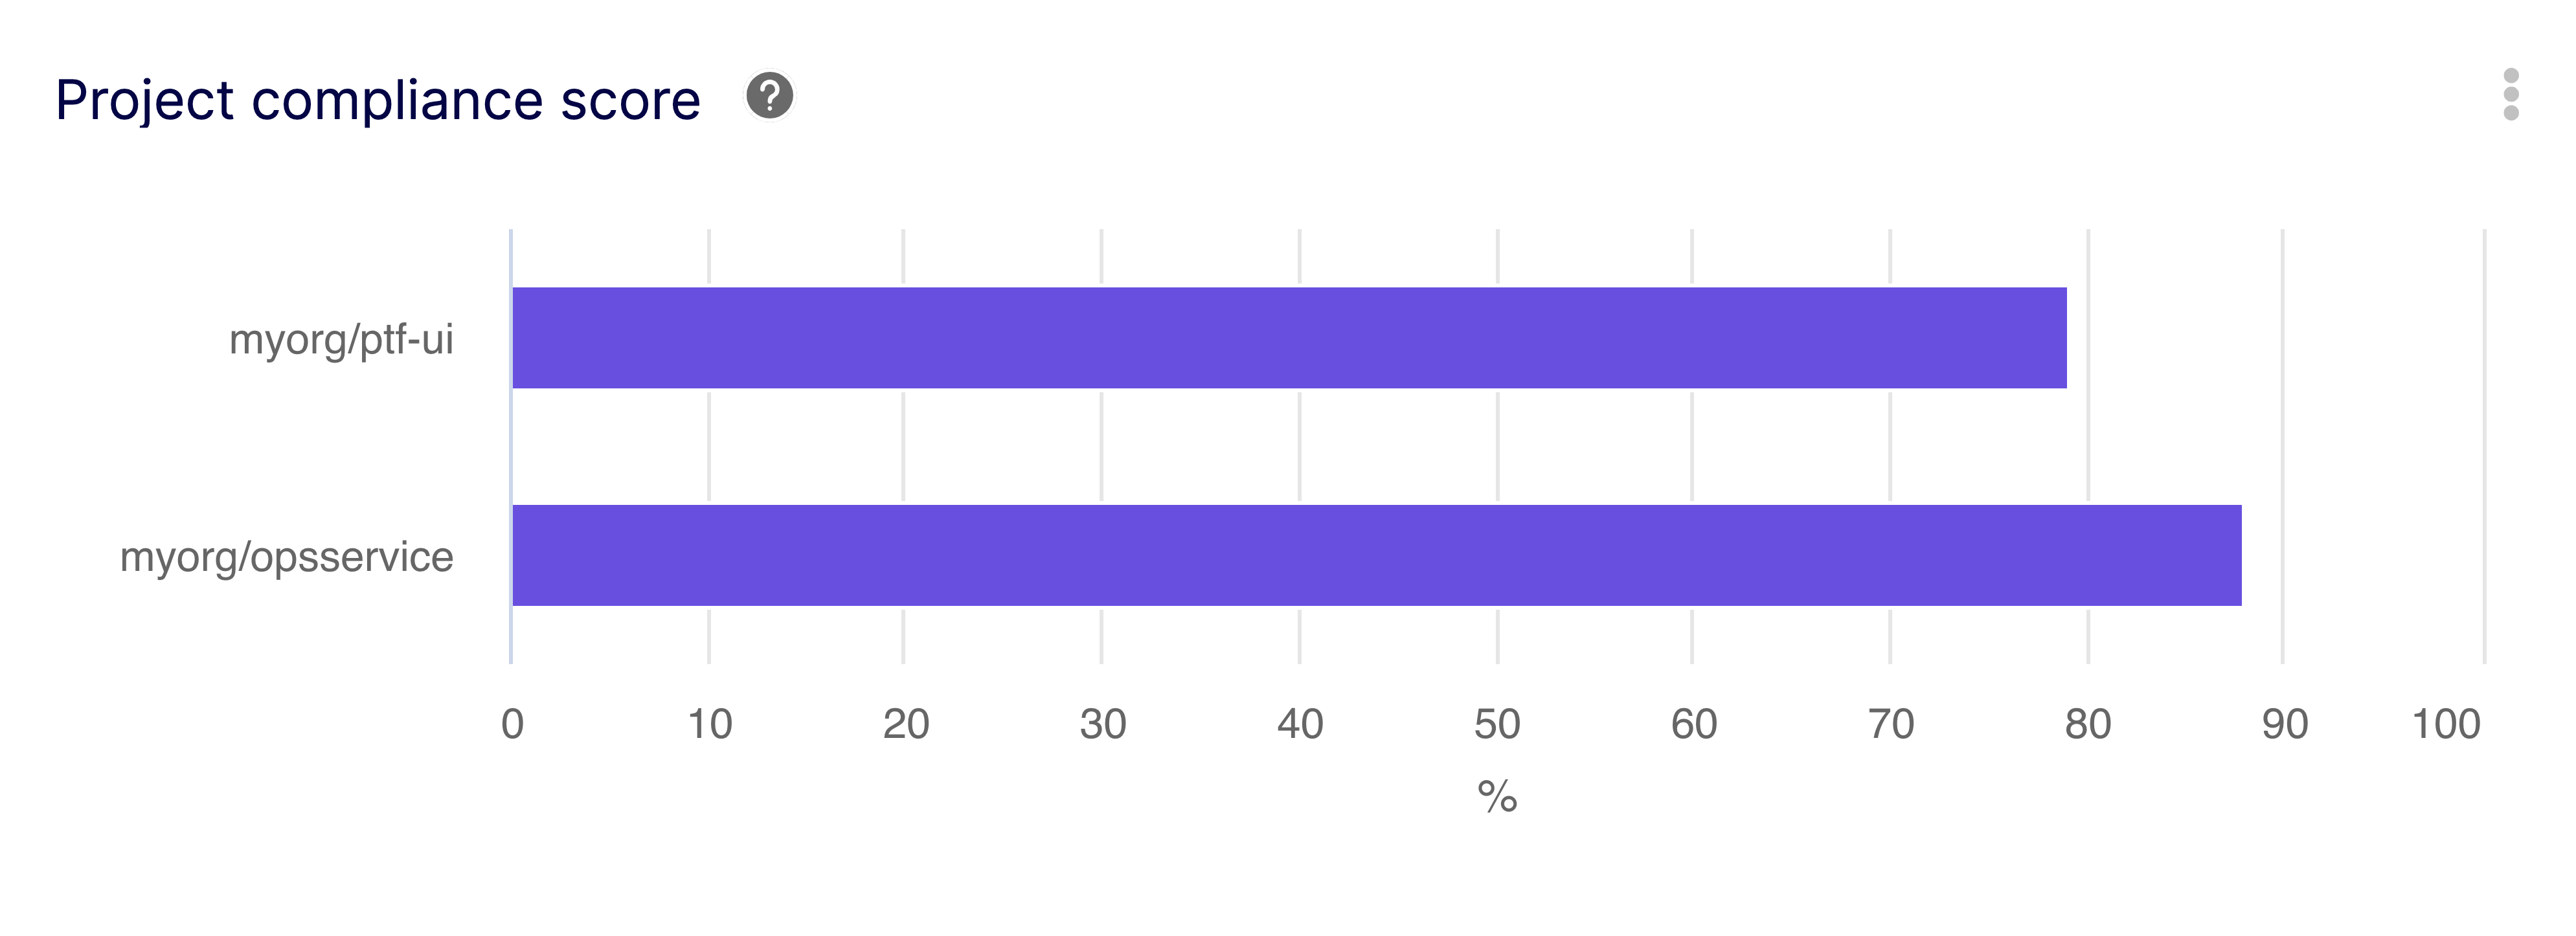
Assess project-level compliance by tracking properly reviewed and tested merges.
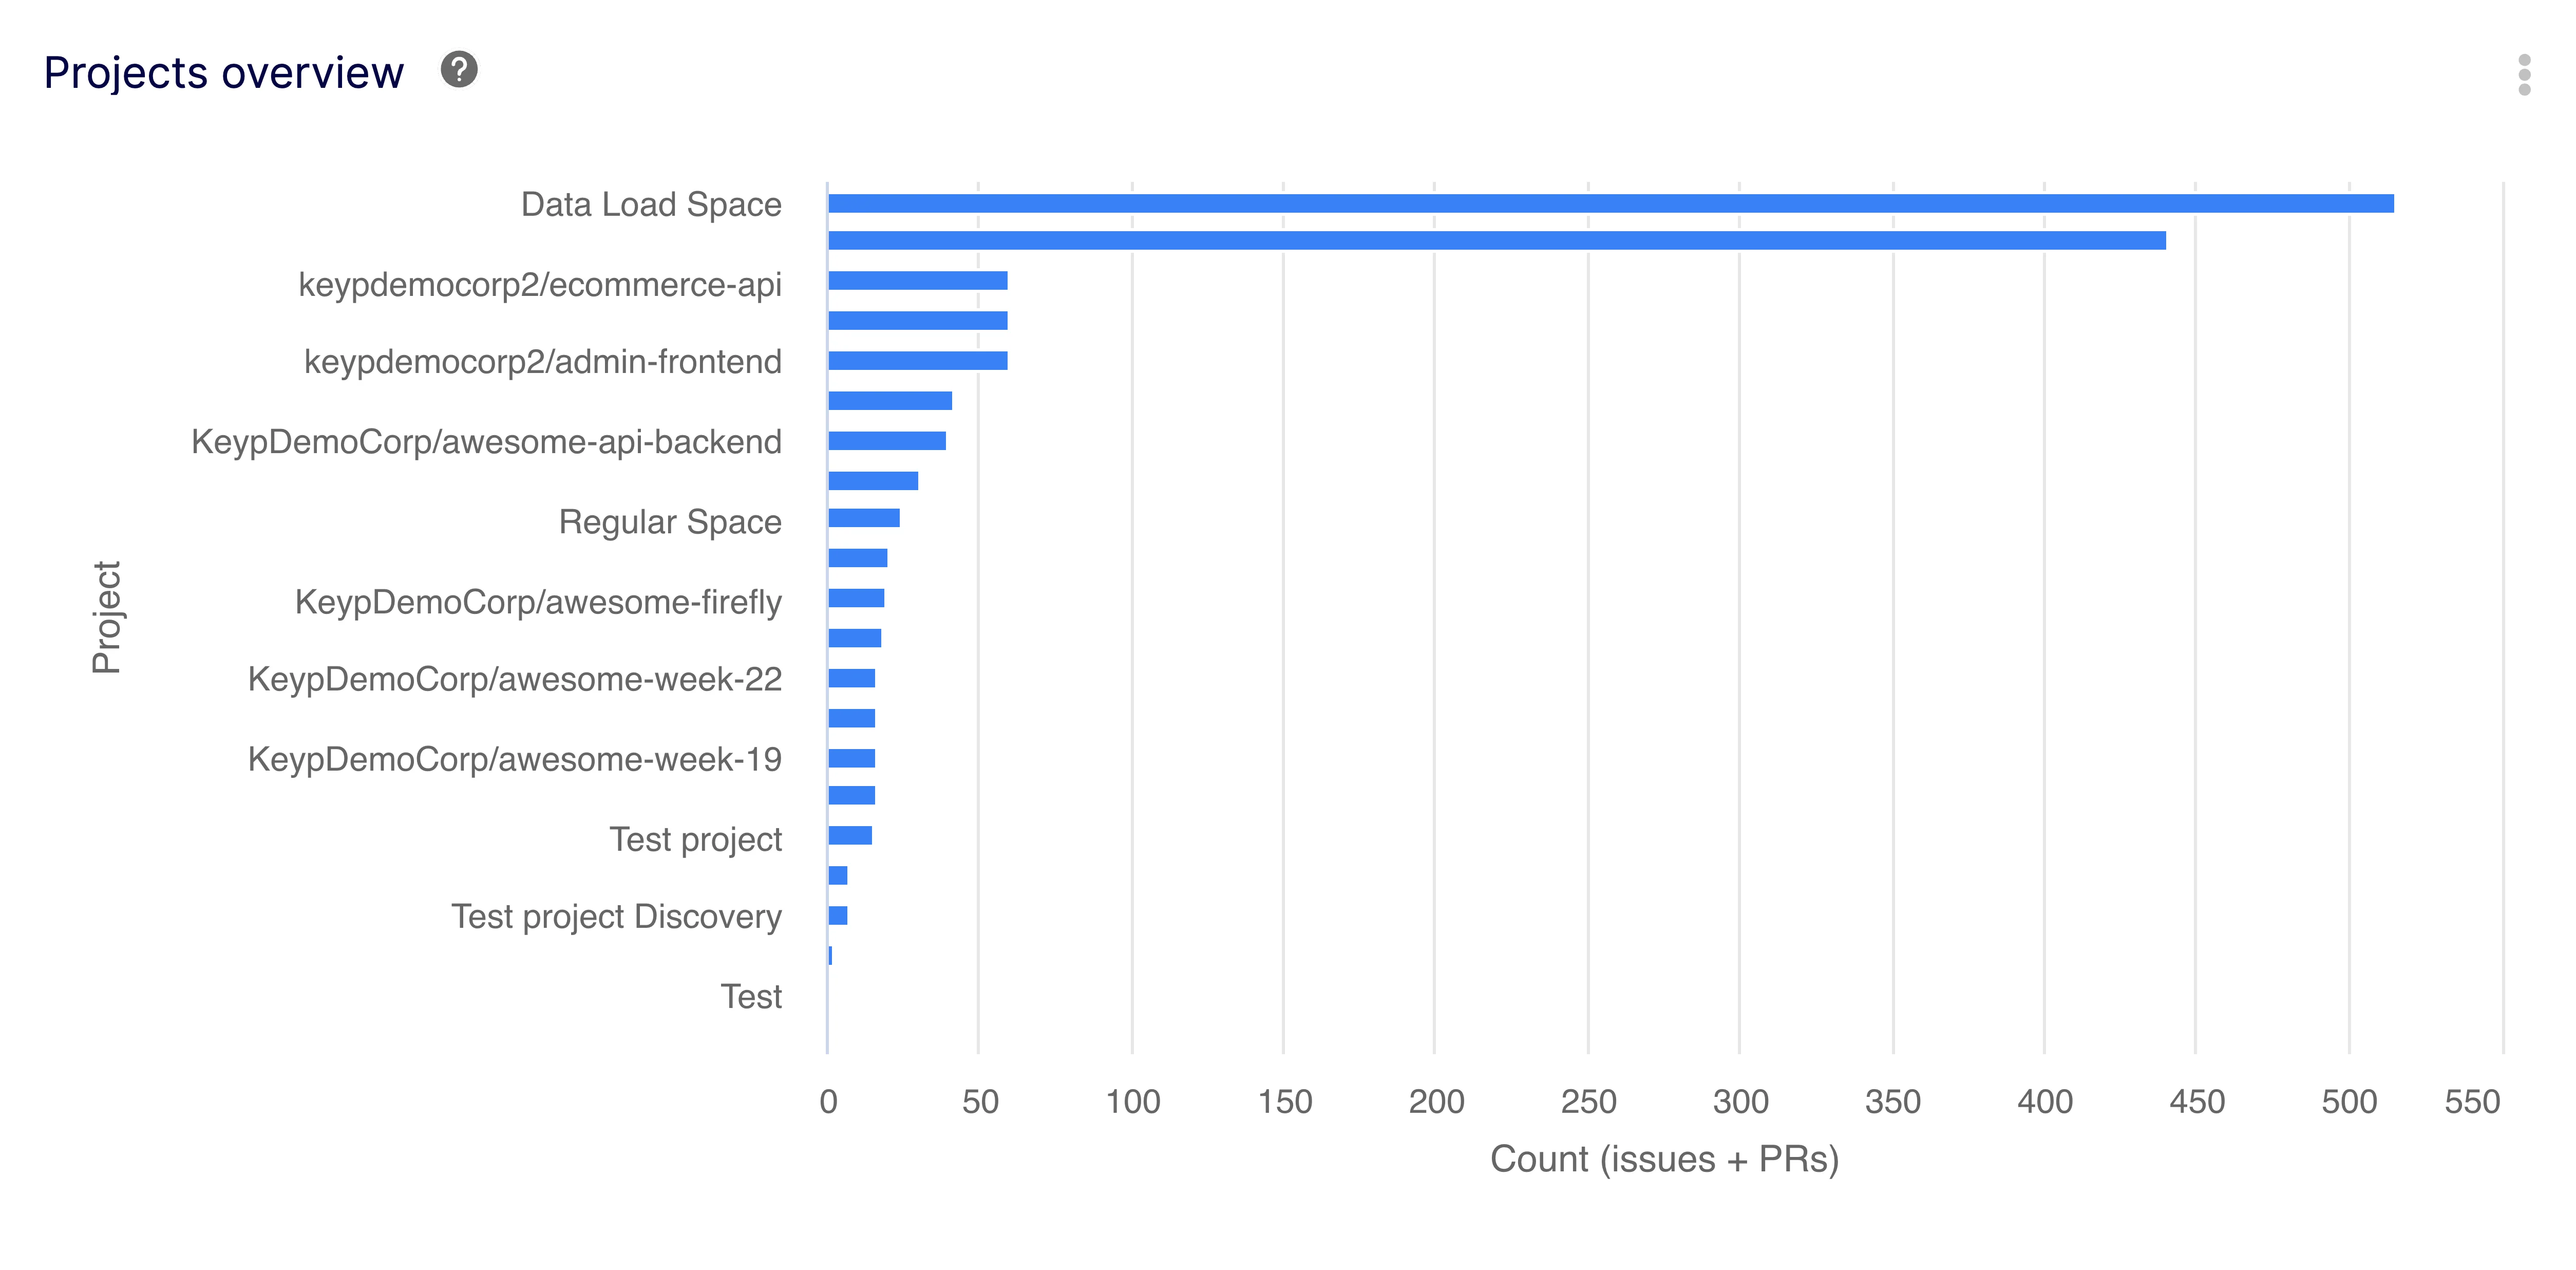
Get a comprehensive status report of all active software projects in one dashboard.
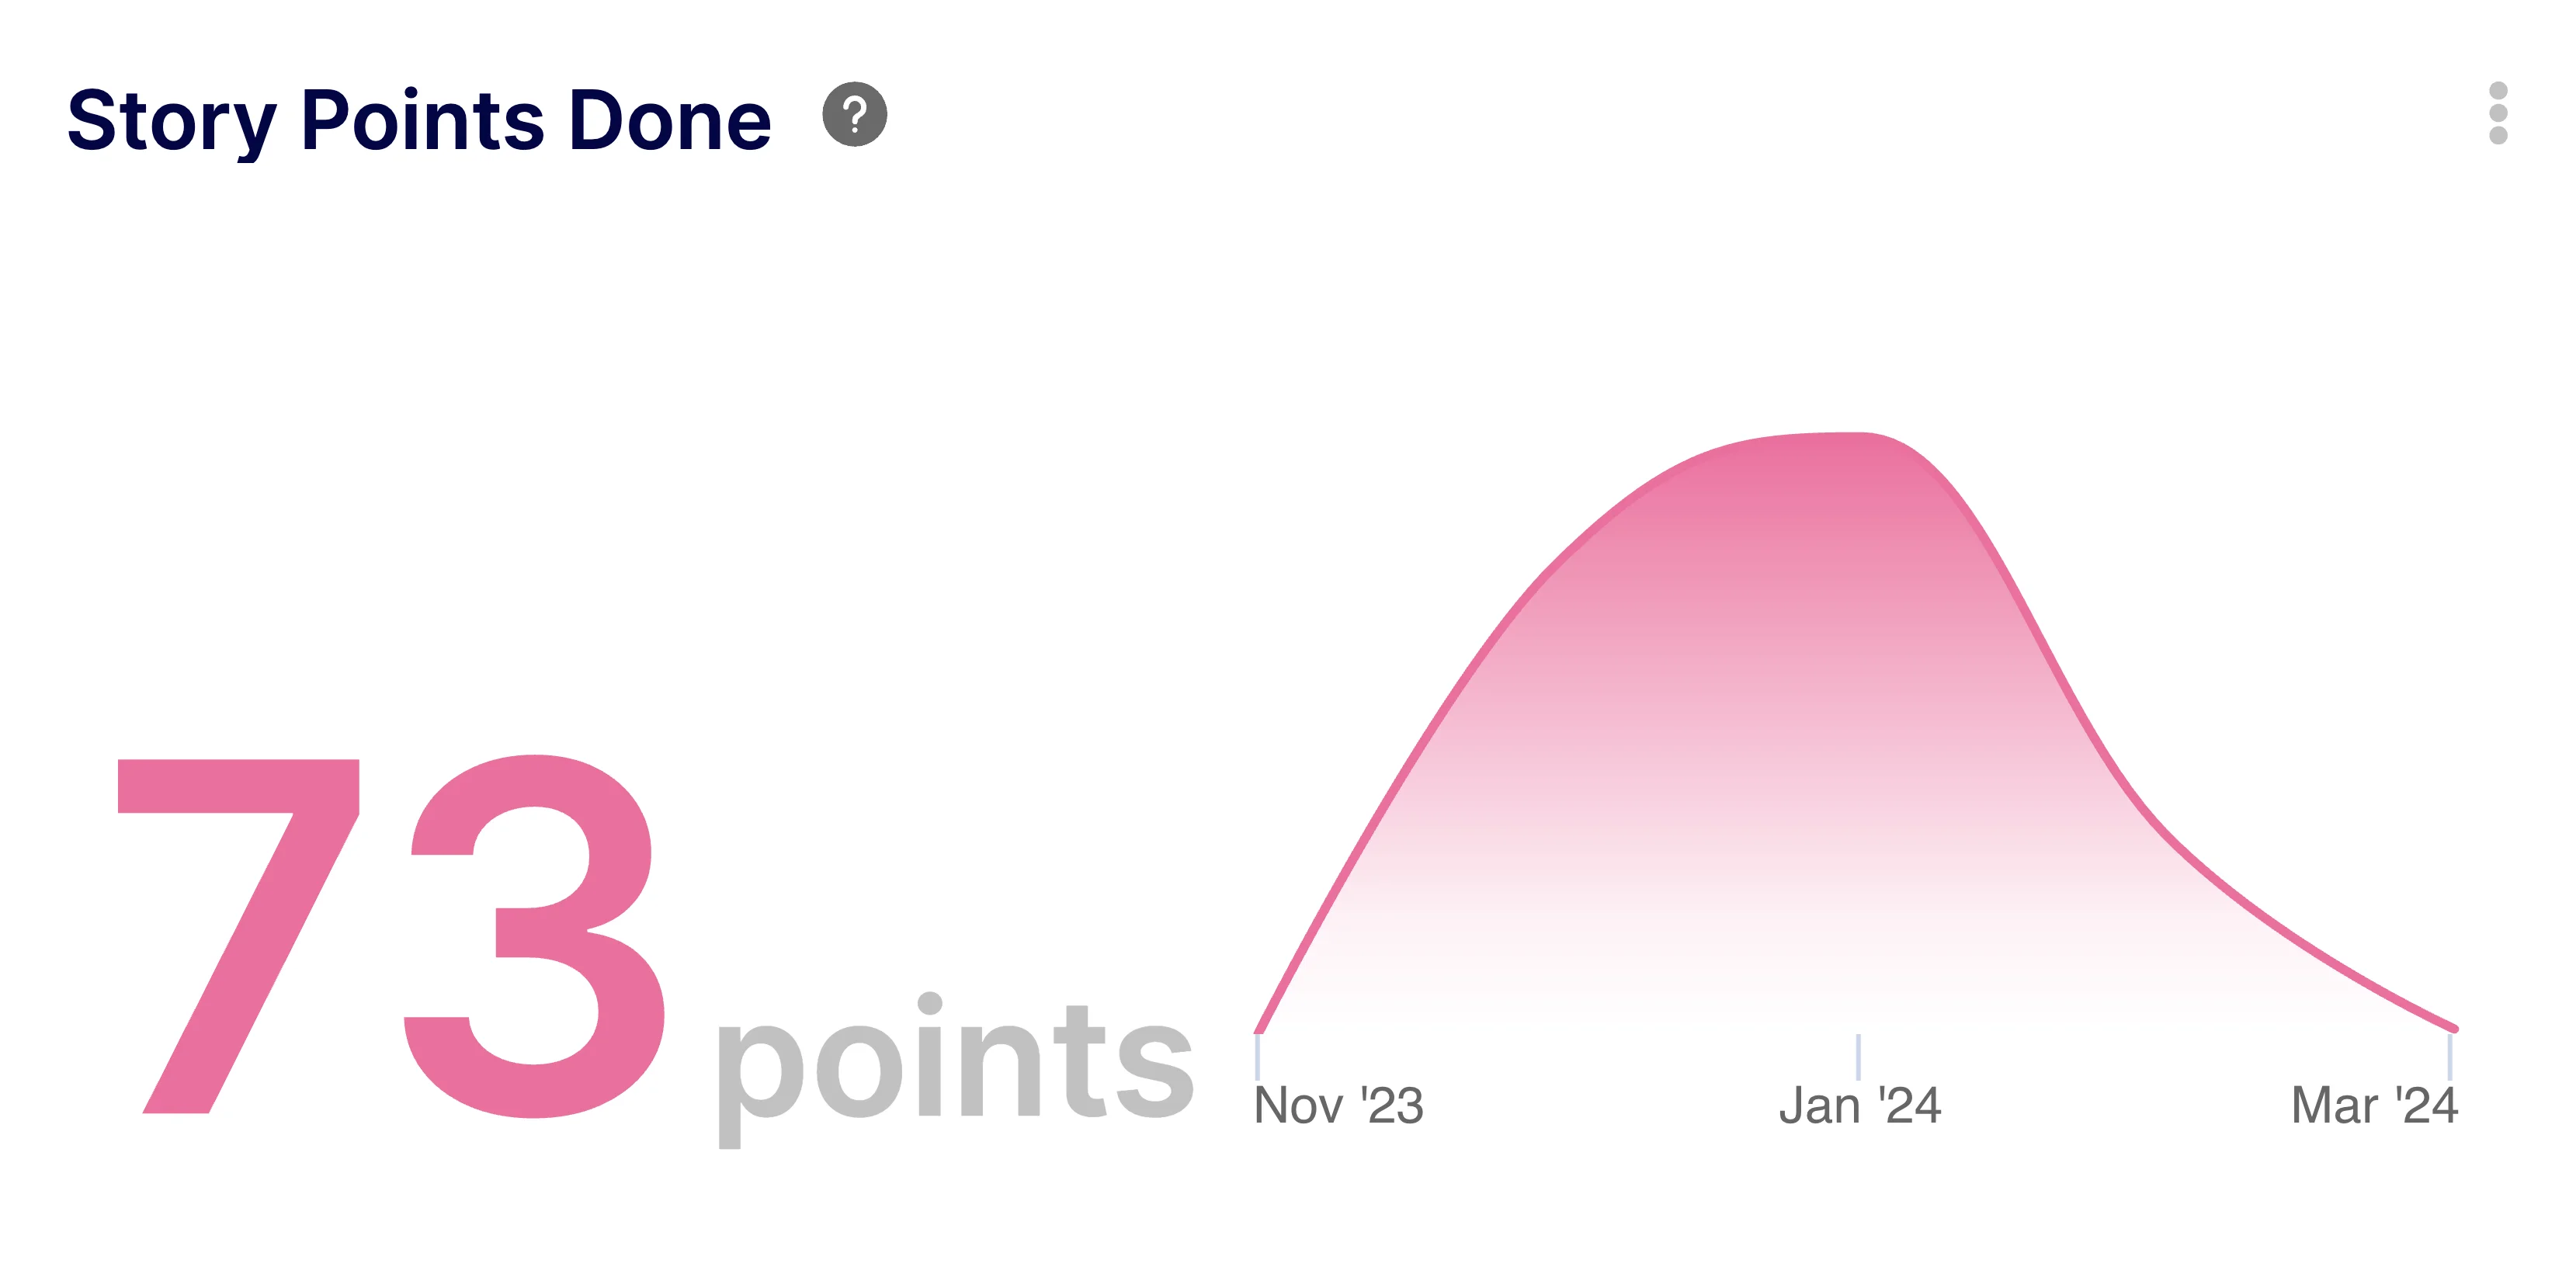
Track completed story points to measure velocity and sprint goal achievement.
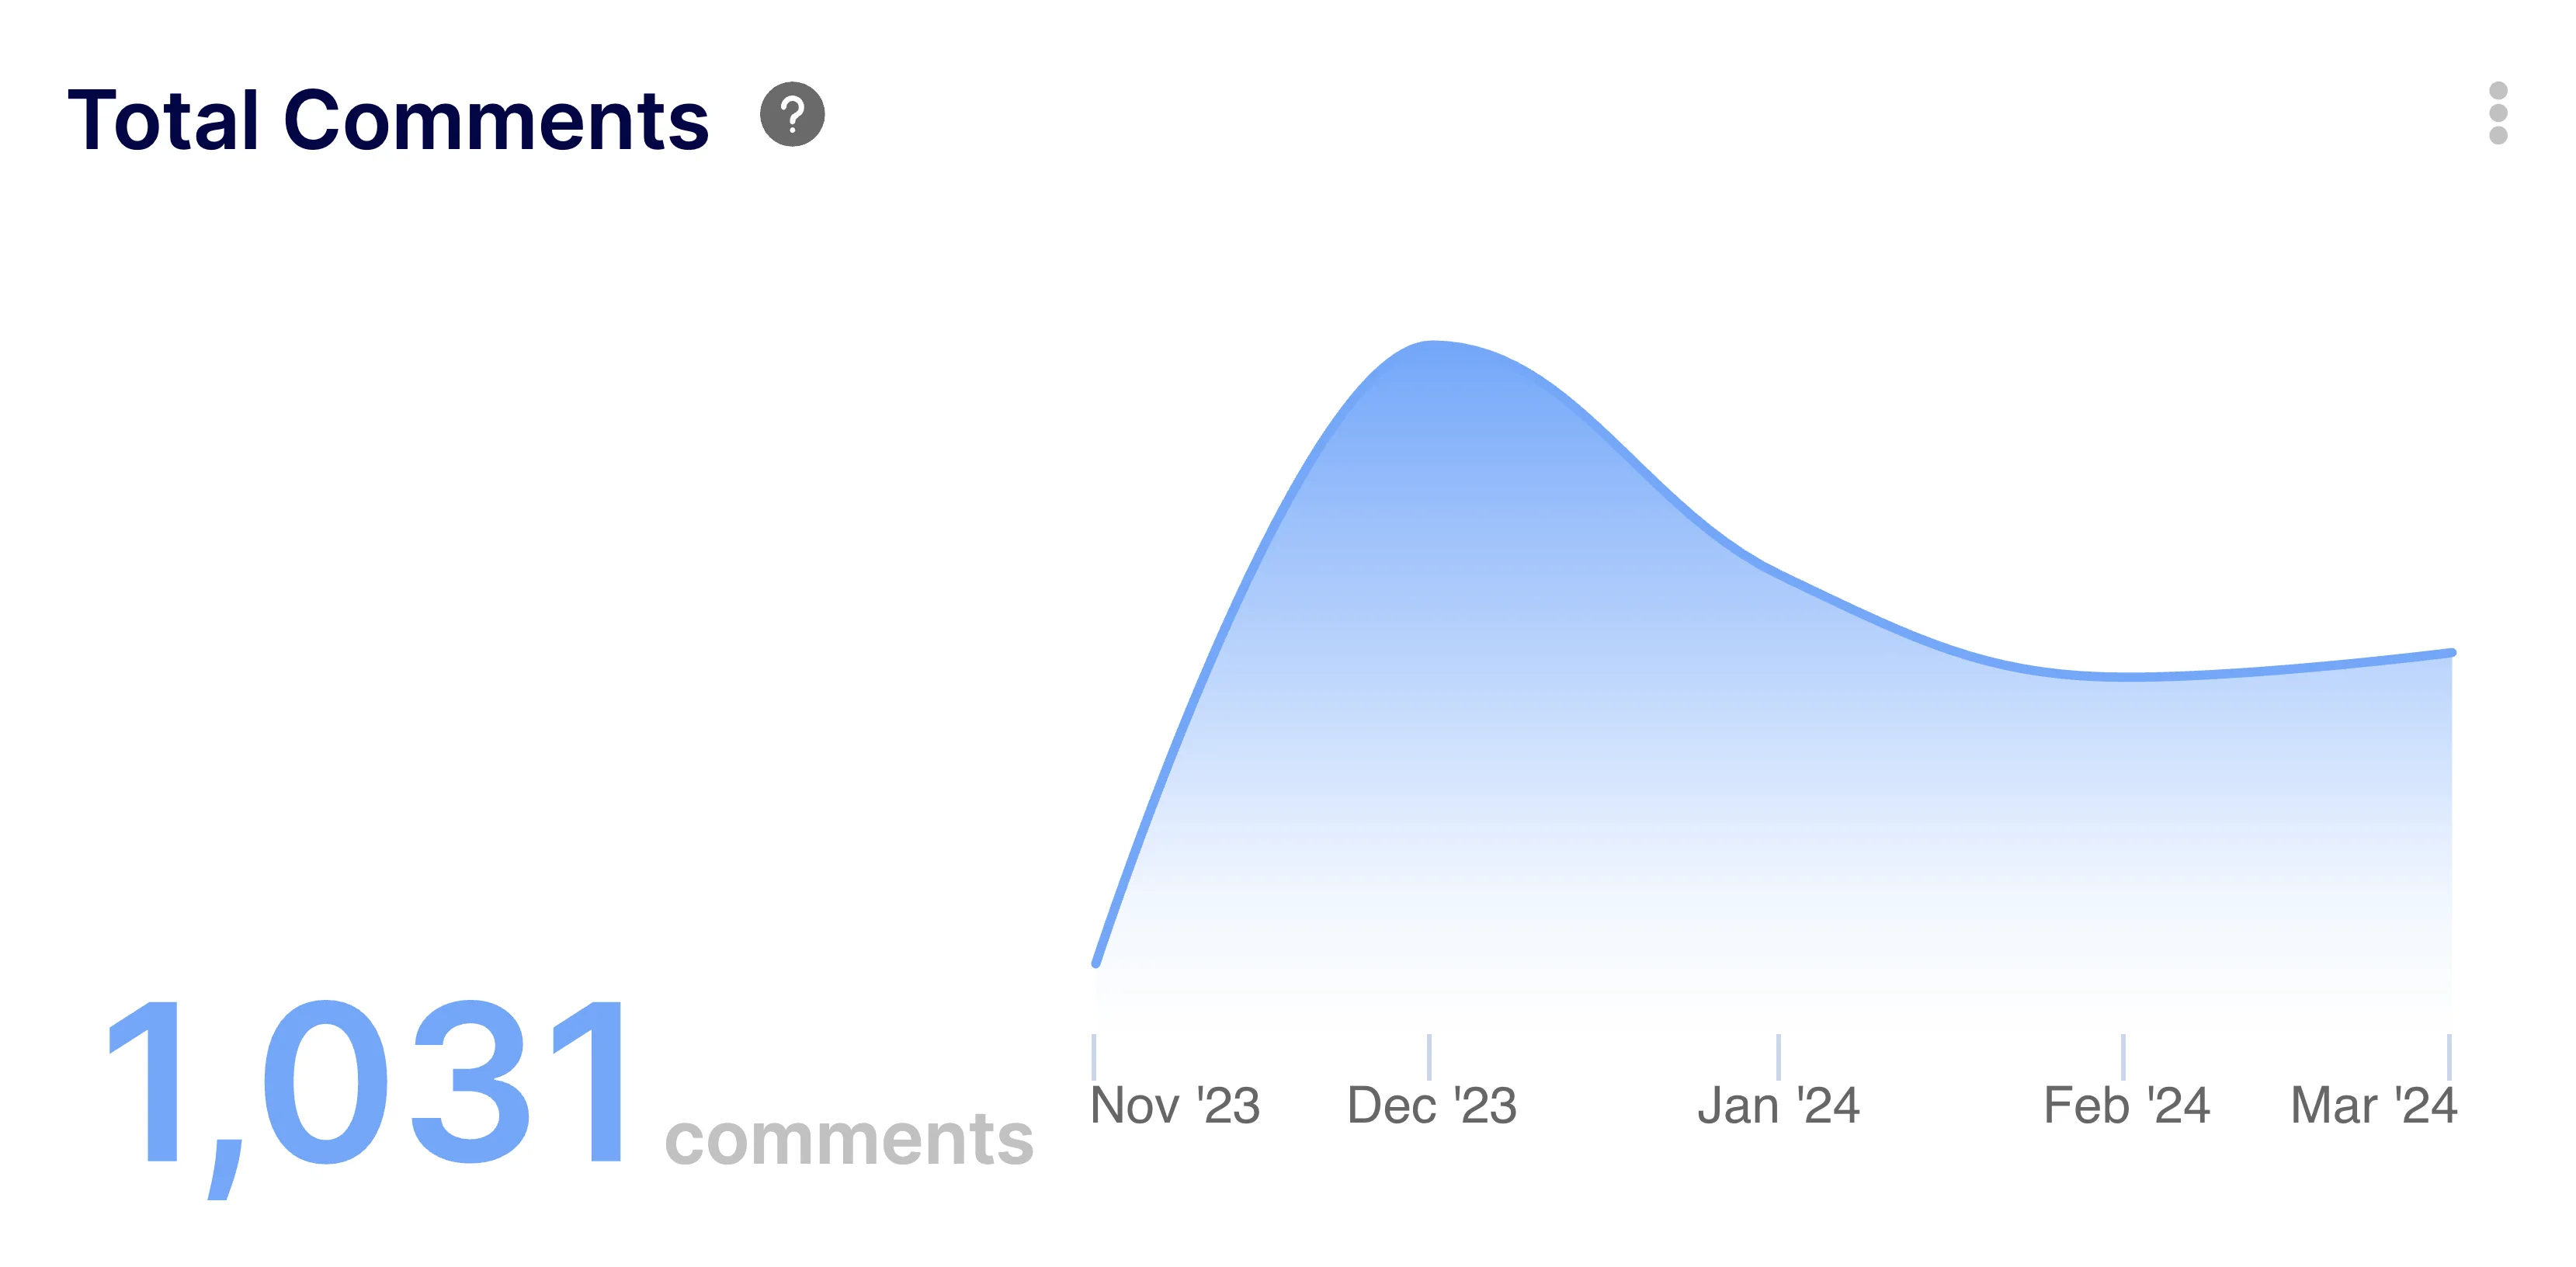
Count total comments to gauge the level of discussion and collaboration in your PRs.
Measure the volume of code added and deleted to understand project scale changes.
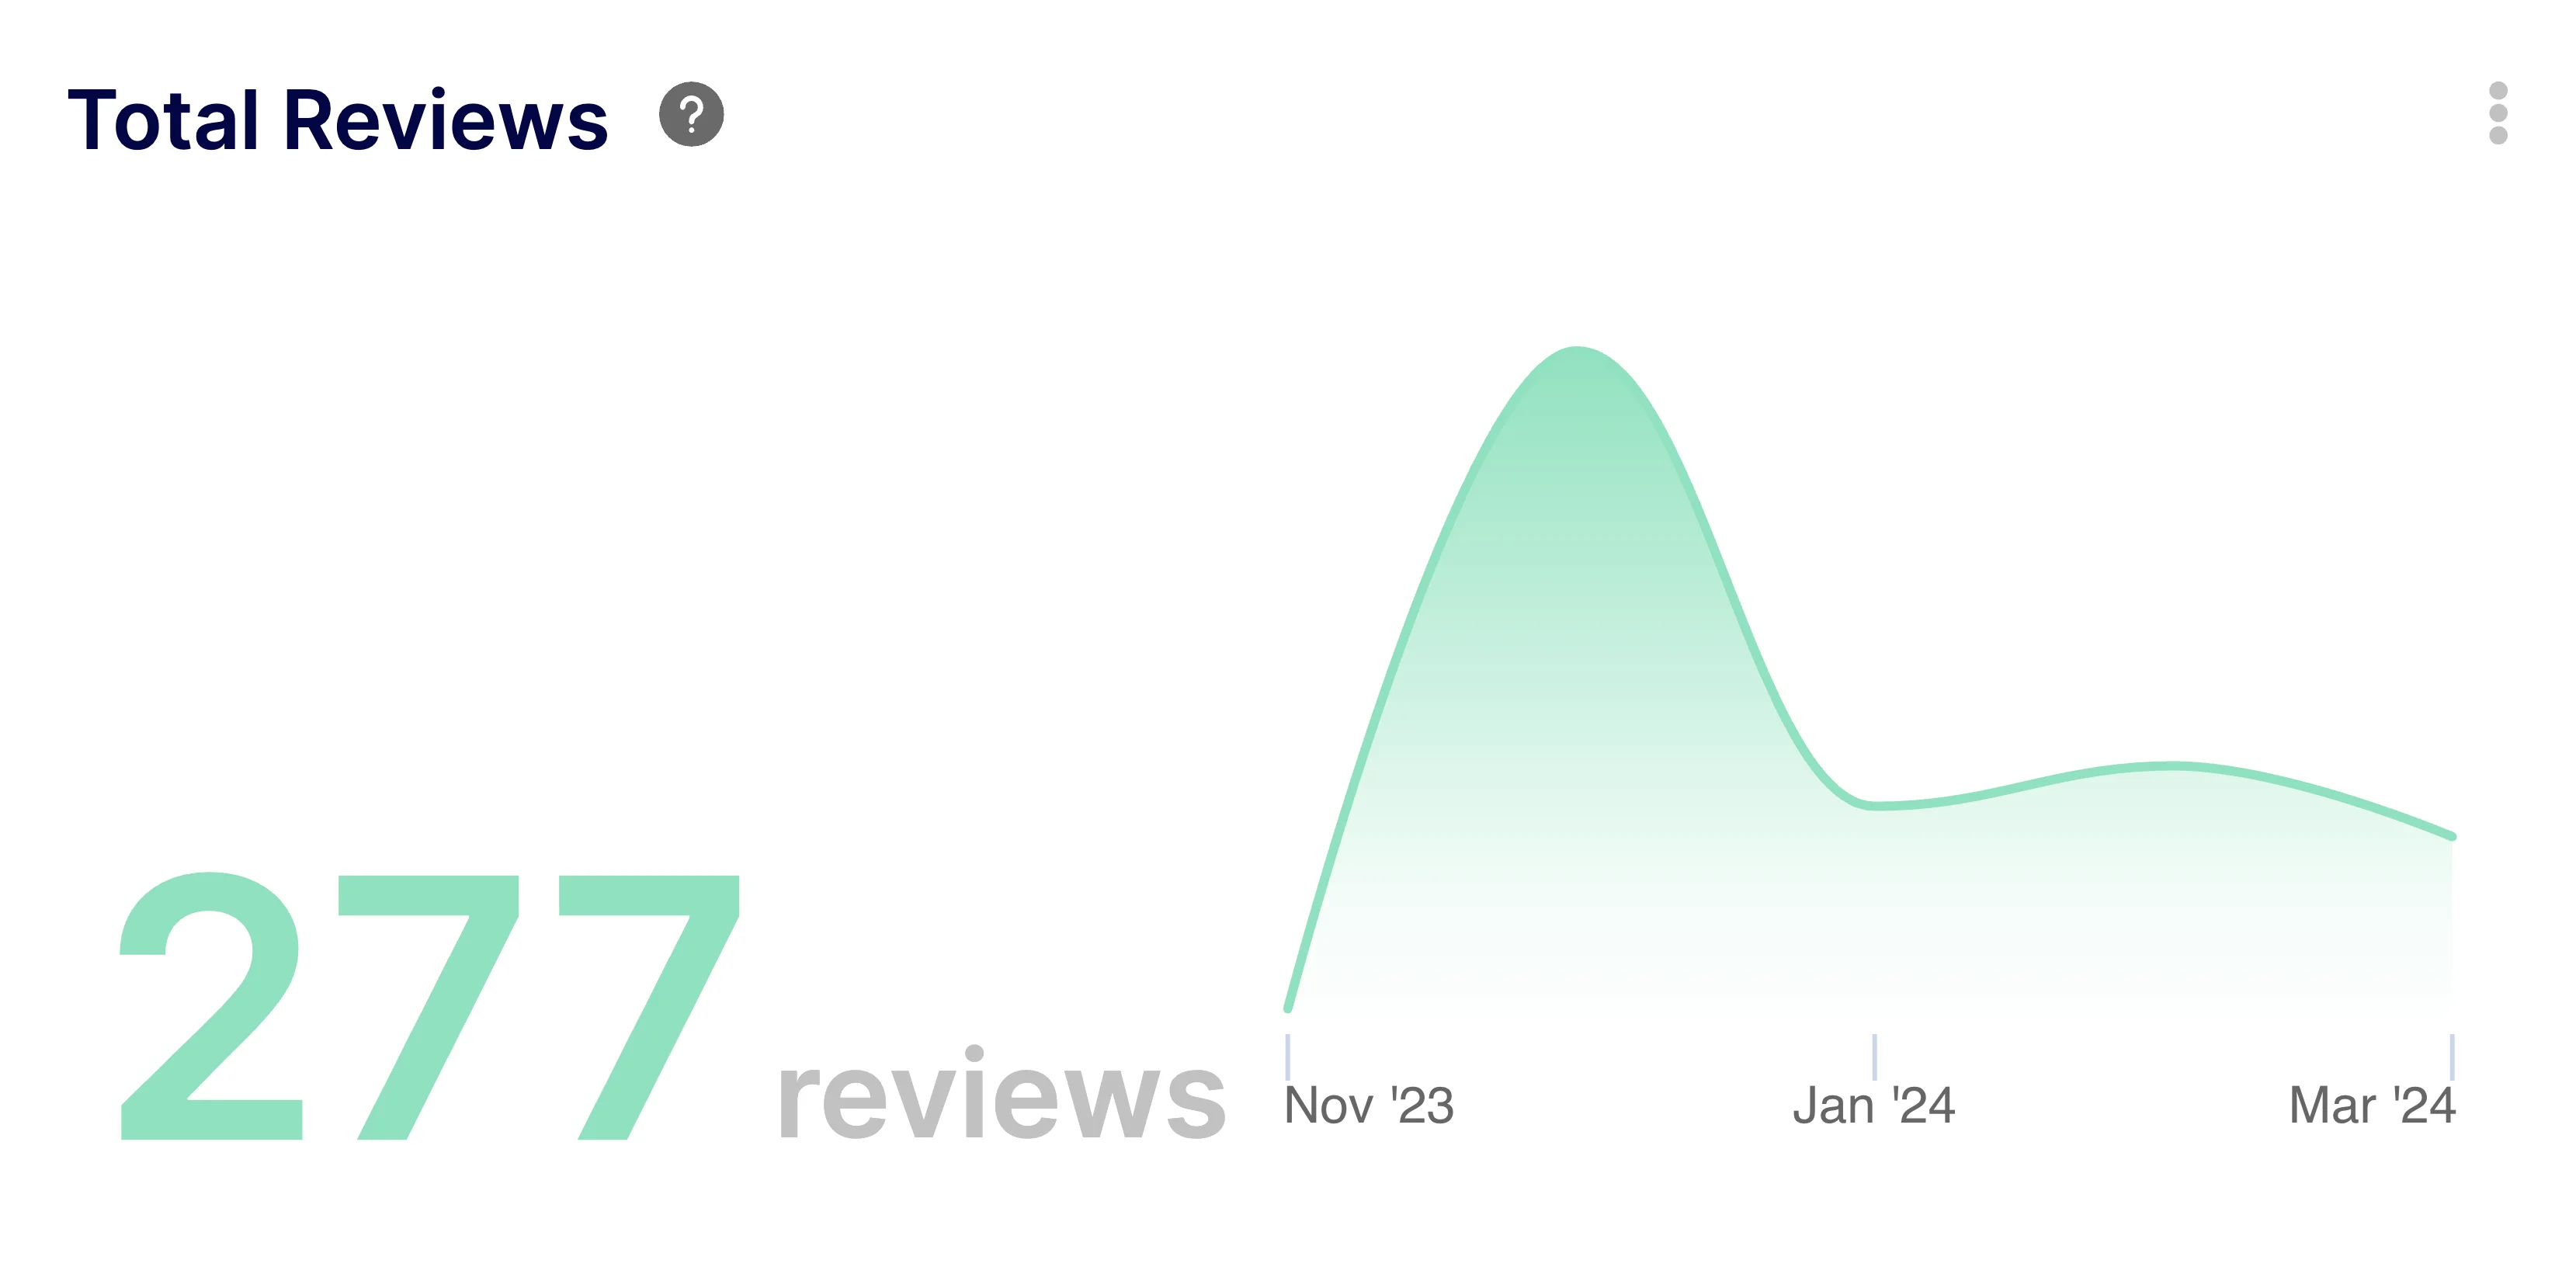
Track the total number of code reviews to ensure quality standards are being met.
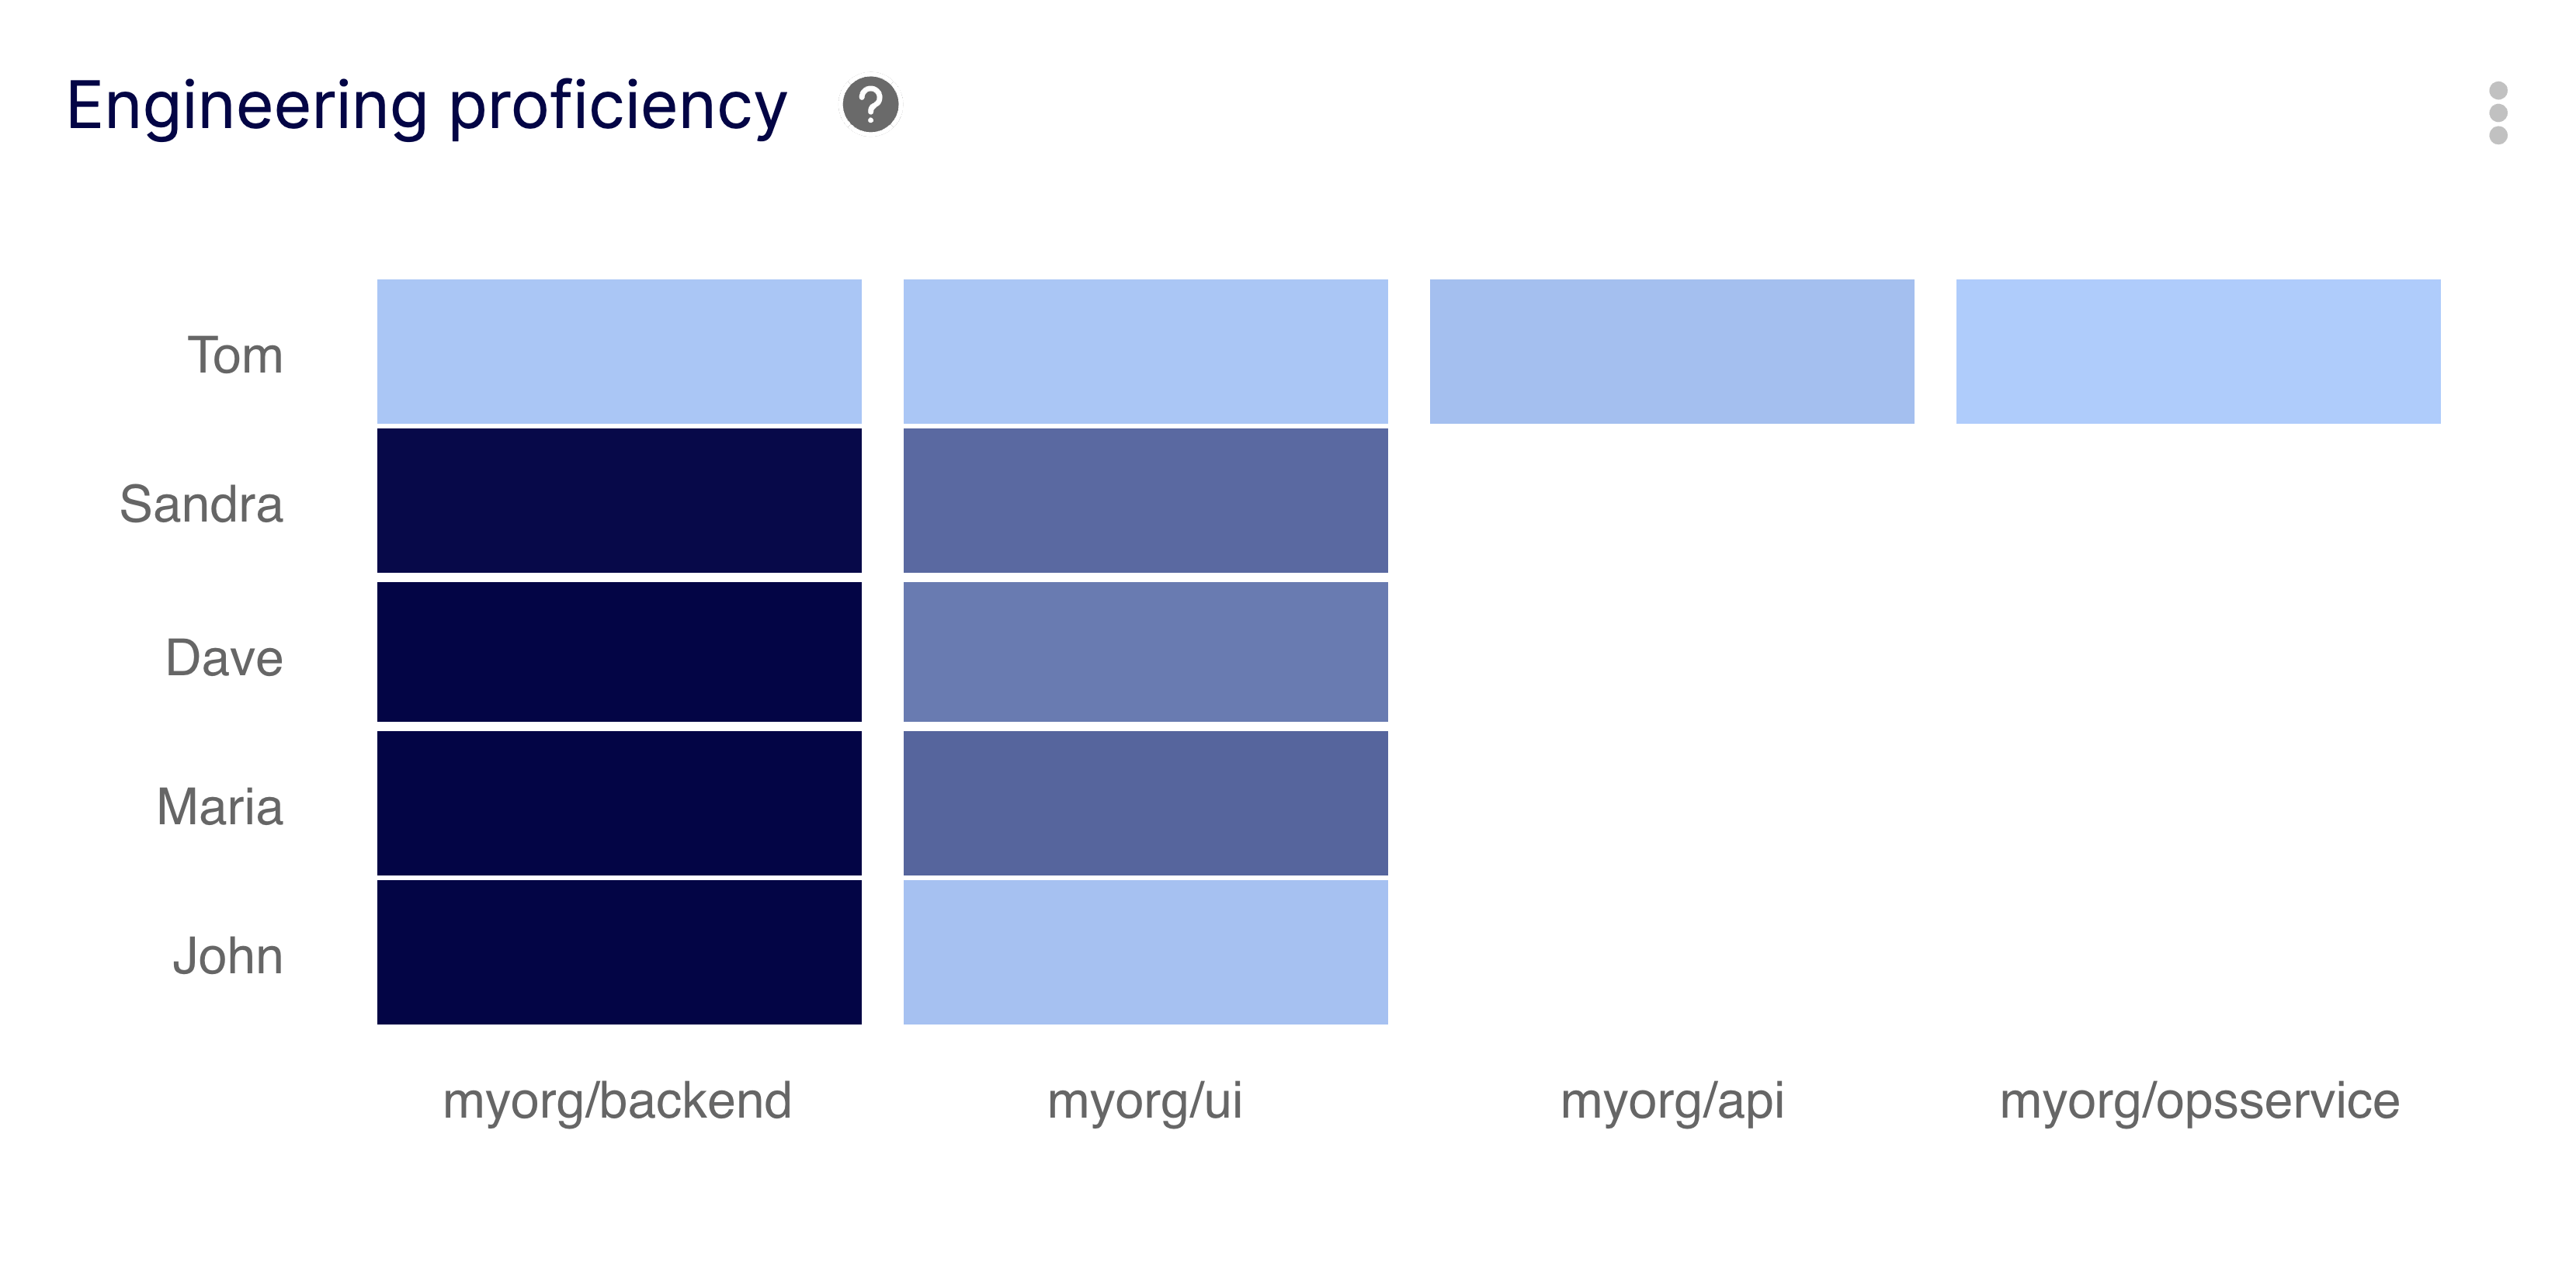
Evaluate engineering proficiency based on contribution patterns and review quality.
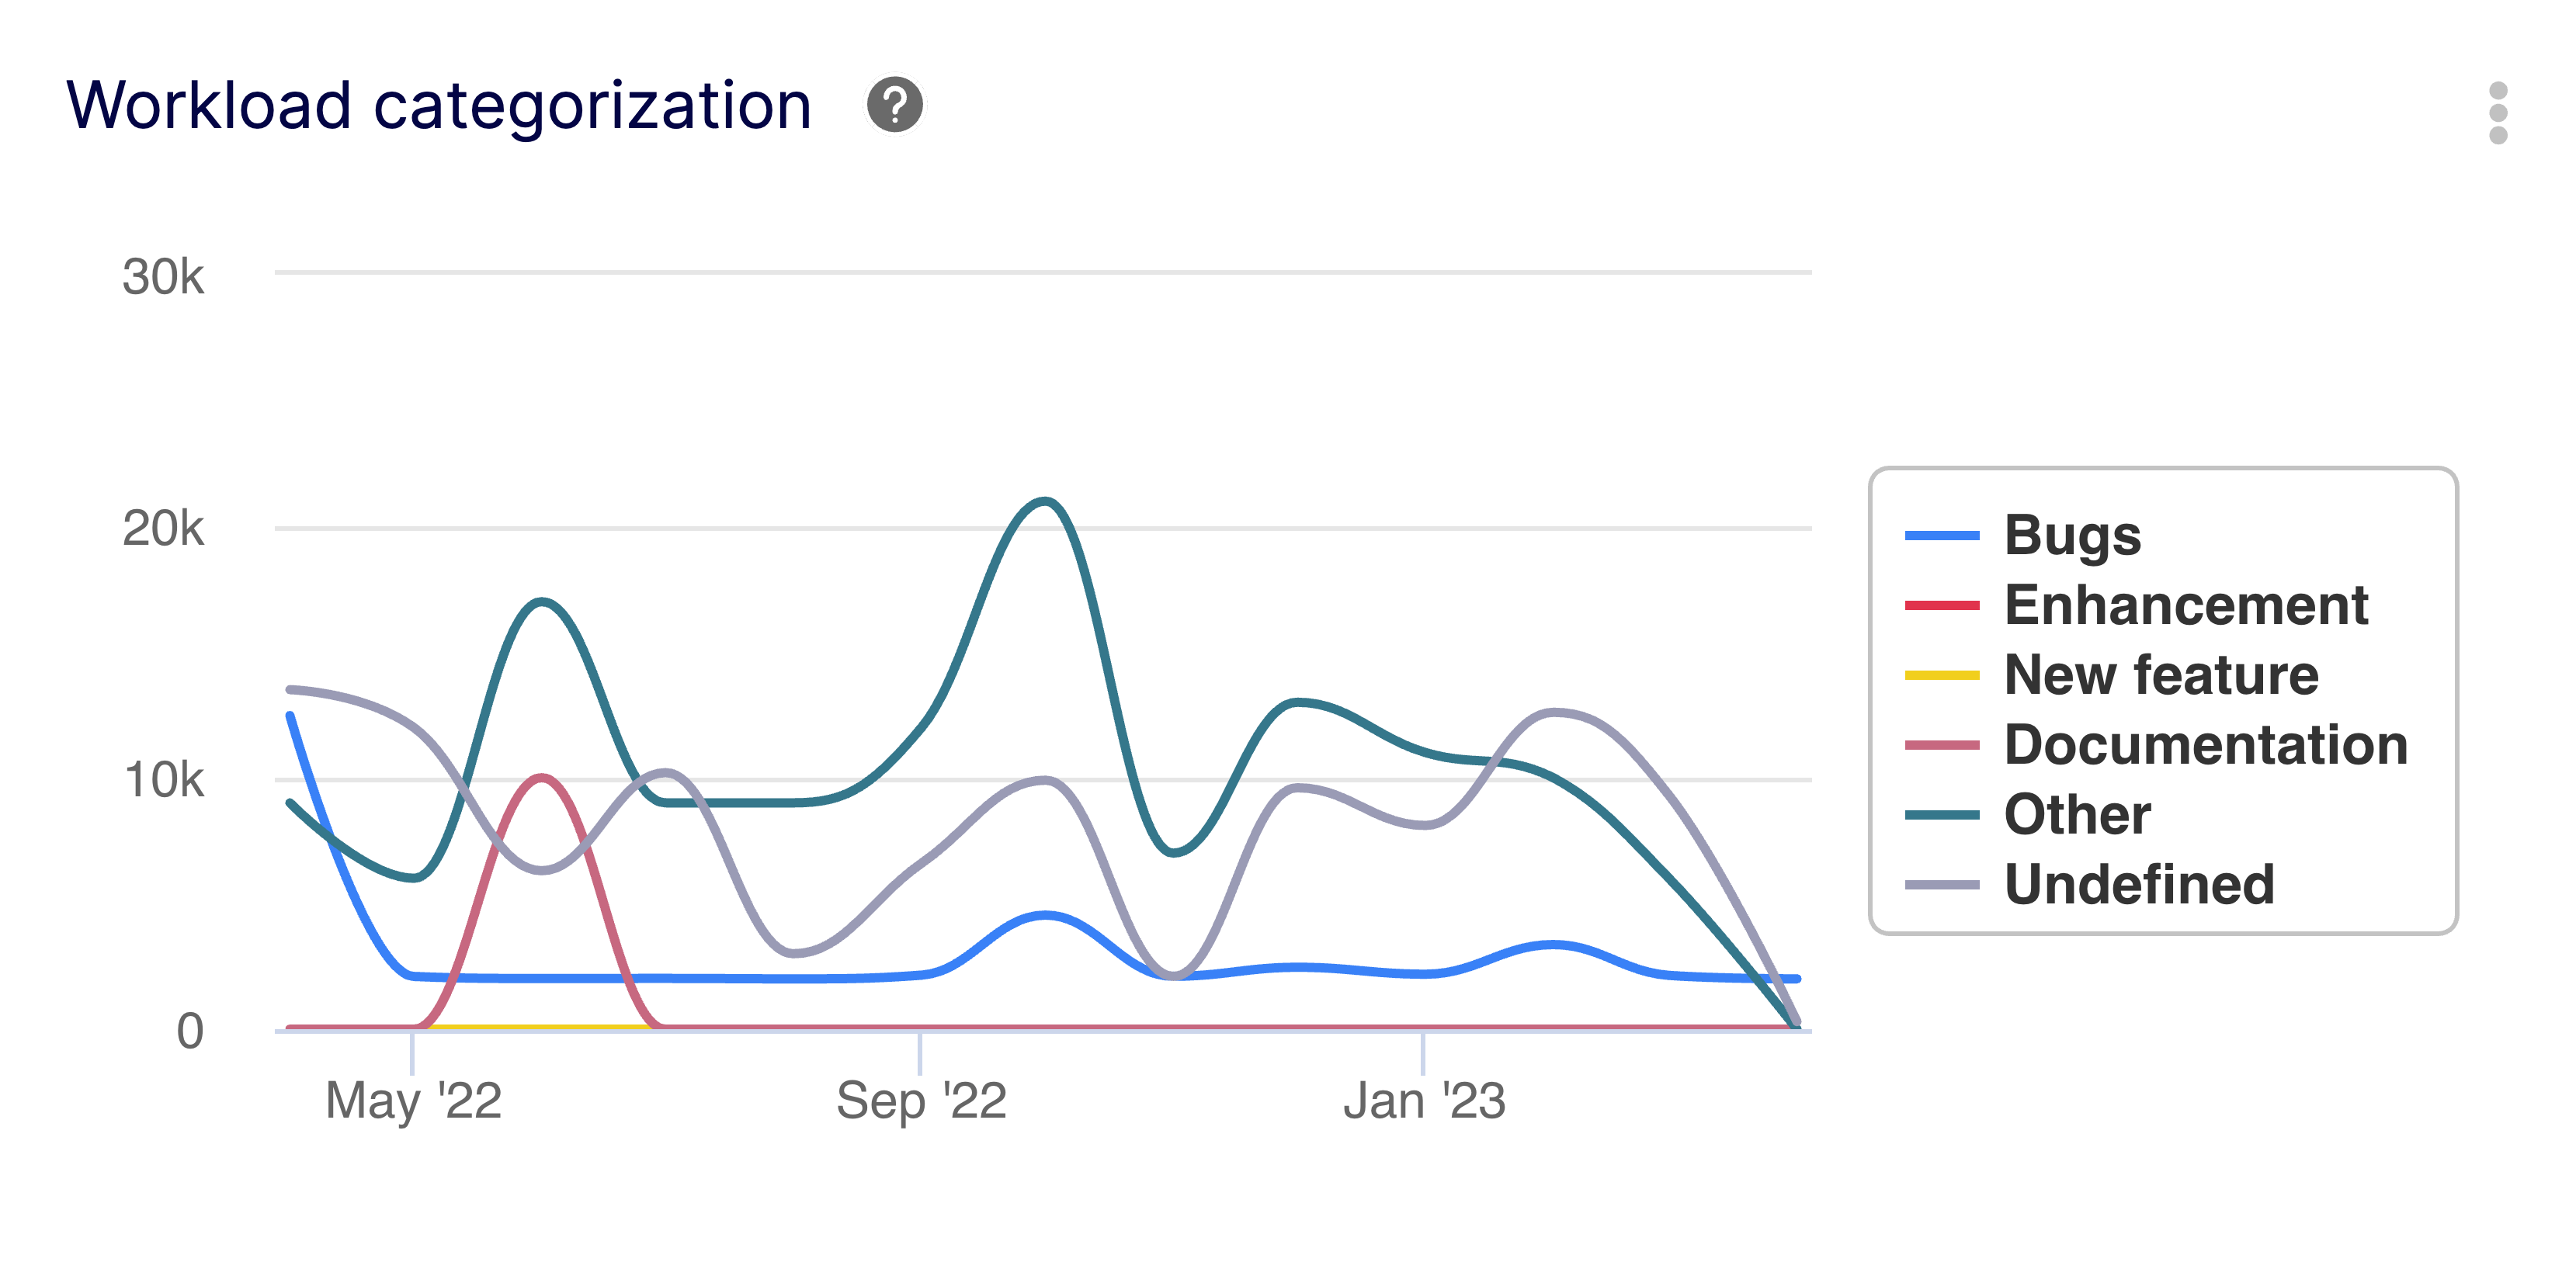
Categorize engineering work to balance maintenance, new features, and bug fixes.