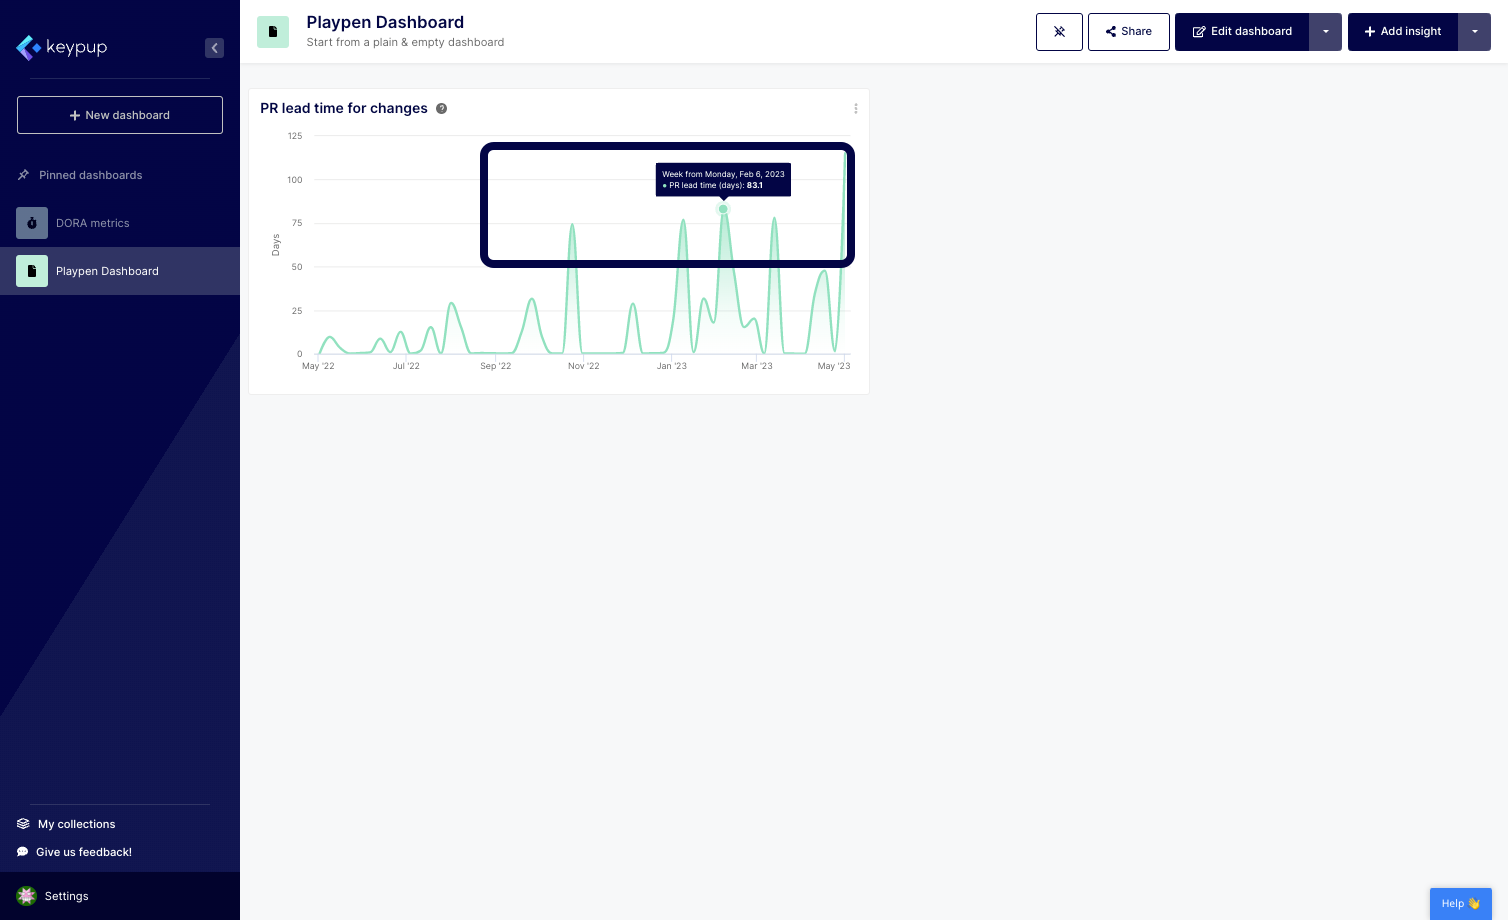
As a tech leader, you understand the importance of using engineering metrics and KPIs to measure your organization's performance. However, it's not enough to just look at high-level metrics – to truly understand what's driving good or bad results, you need to dig into the details. This is where Keypup's drill-down feature comes in handy. With this powerful tool, you can explore the engineering metrics details that matter to you and get a deeper understanding of your organization's performance.
Keypup's templates come with a preconfigured drill-down, which you can fully customize to explore the details that matter to you. When building your own metrics, you can also activate the drill-down, apply the recommended configuration, or build your own view.
Here are the steps to explore engineering metrics details using Keypup's drill-down feature:
1. Click on any data point you want to explore to drill-down into engineering metrics details.
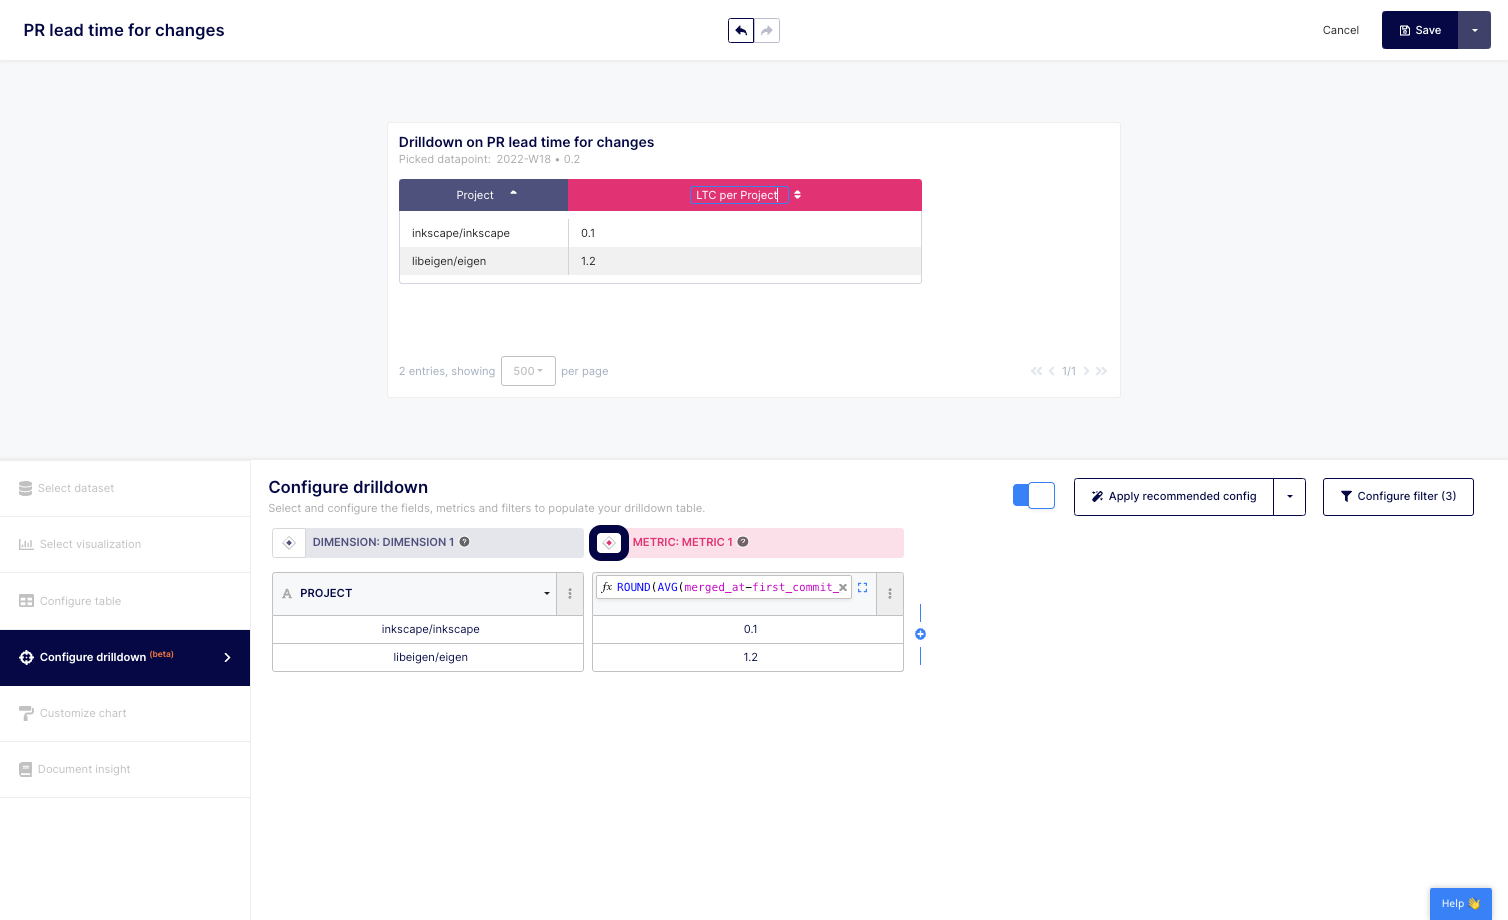
2. A preconfigured table will display to provide you with details related to the data point where you clicked, enabling you to isolate any unconventional behavior.

3. Click on the edit button located at the top right of the drill-down.
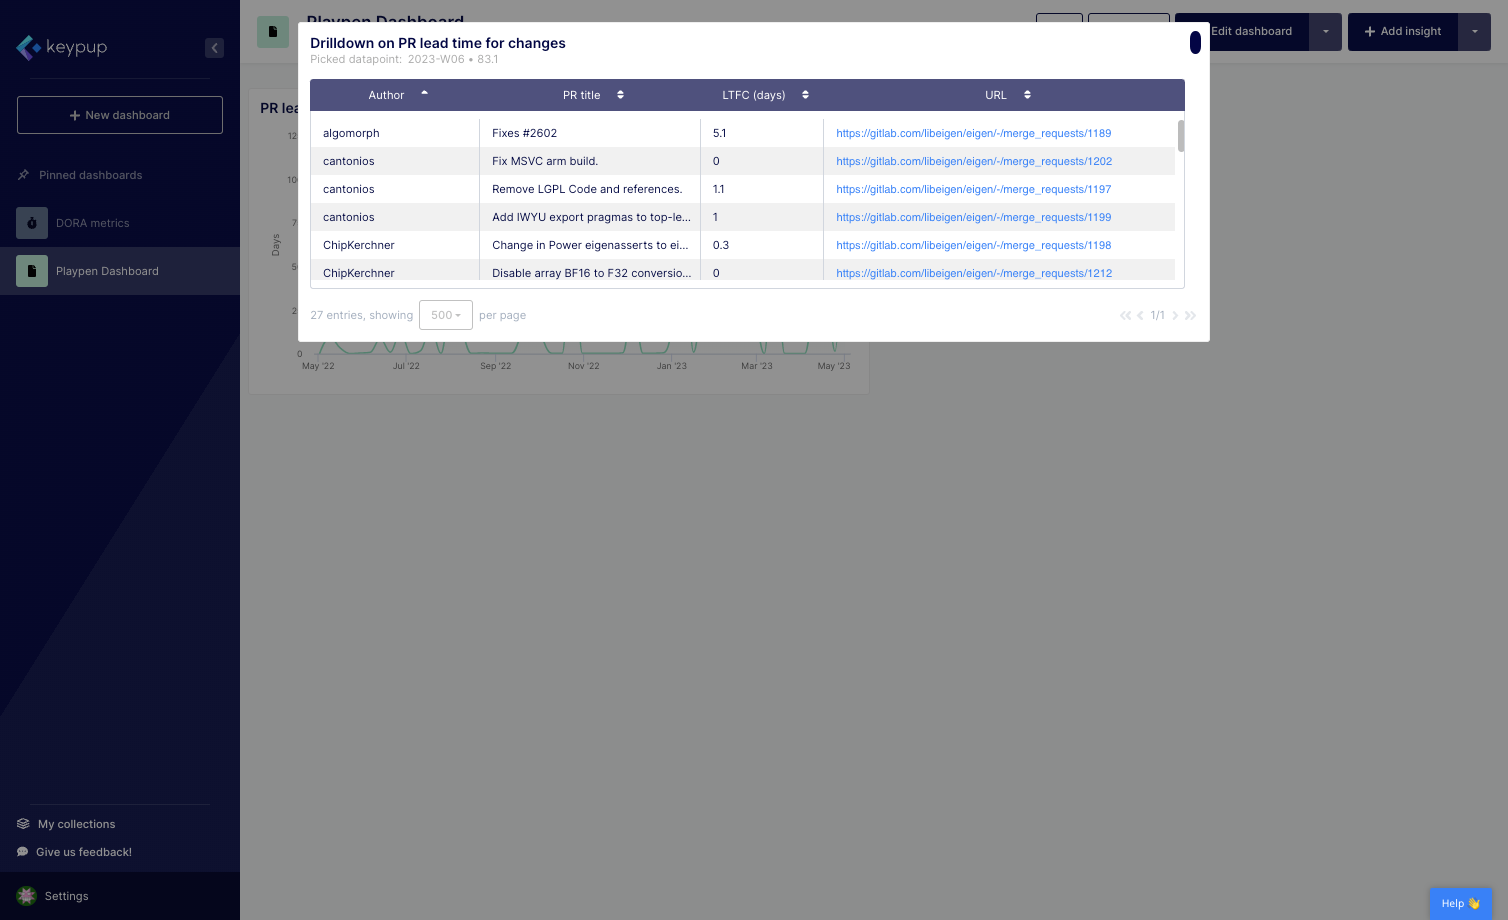
4. Select Edit drill-down.

5. You'll be automatically directed to the "Configure drilldown" tab of the advanced metric configuration panel.
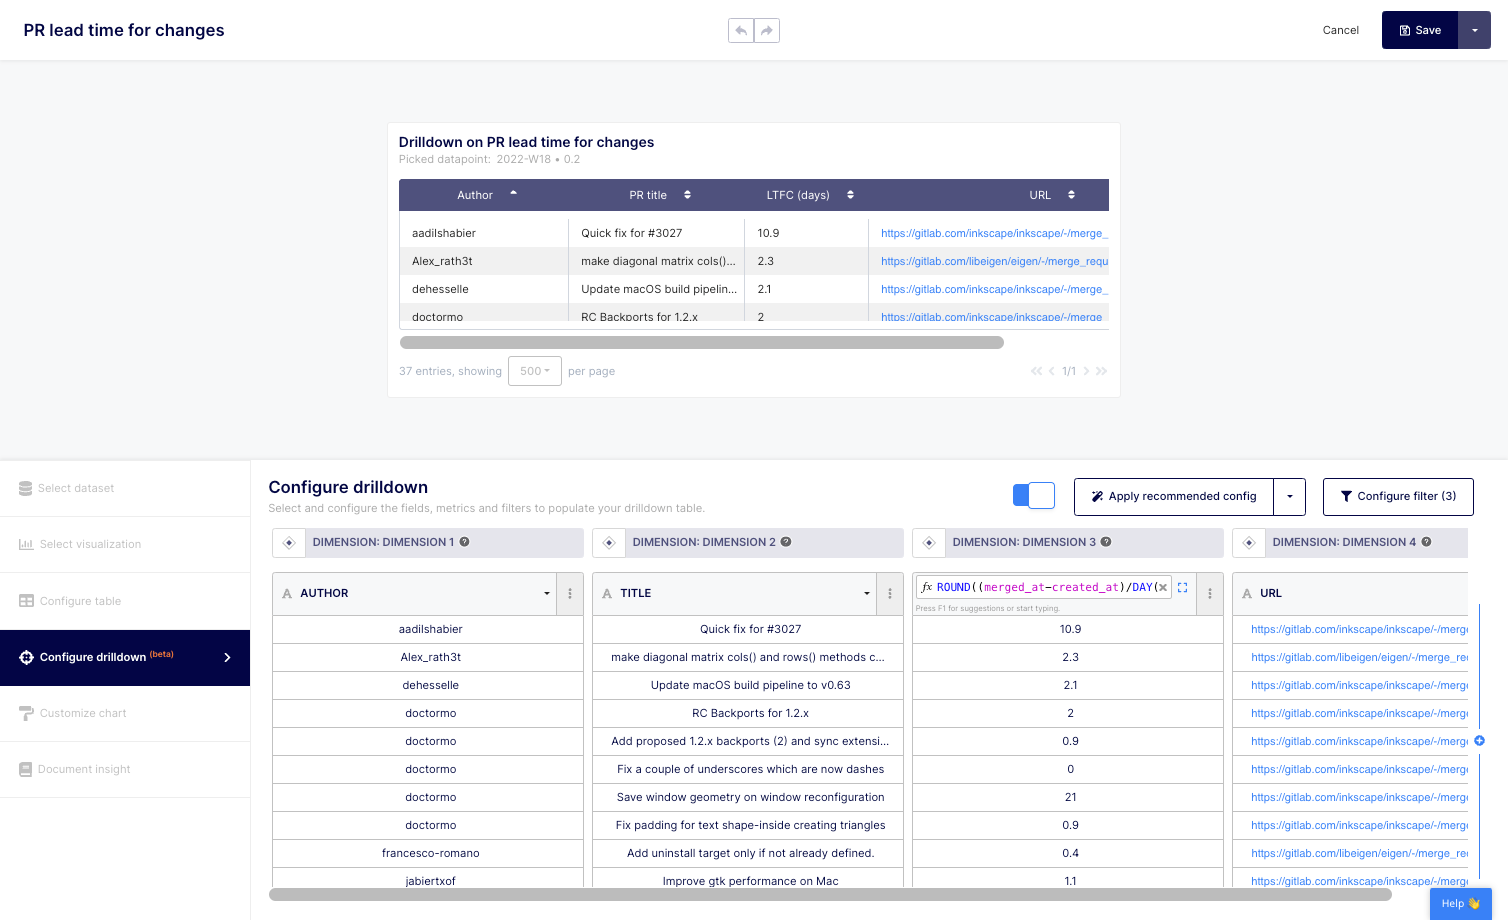
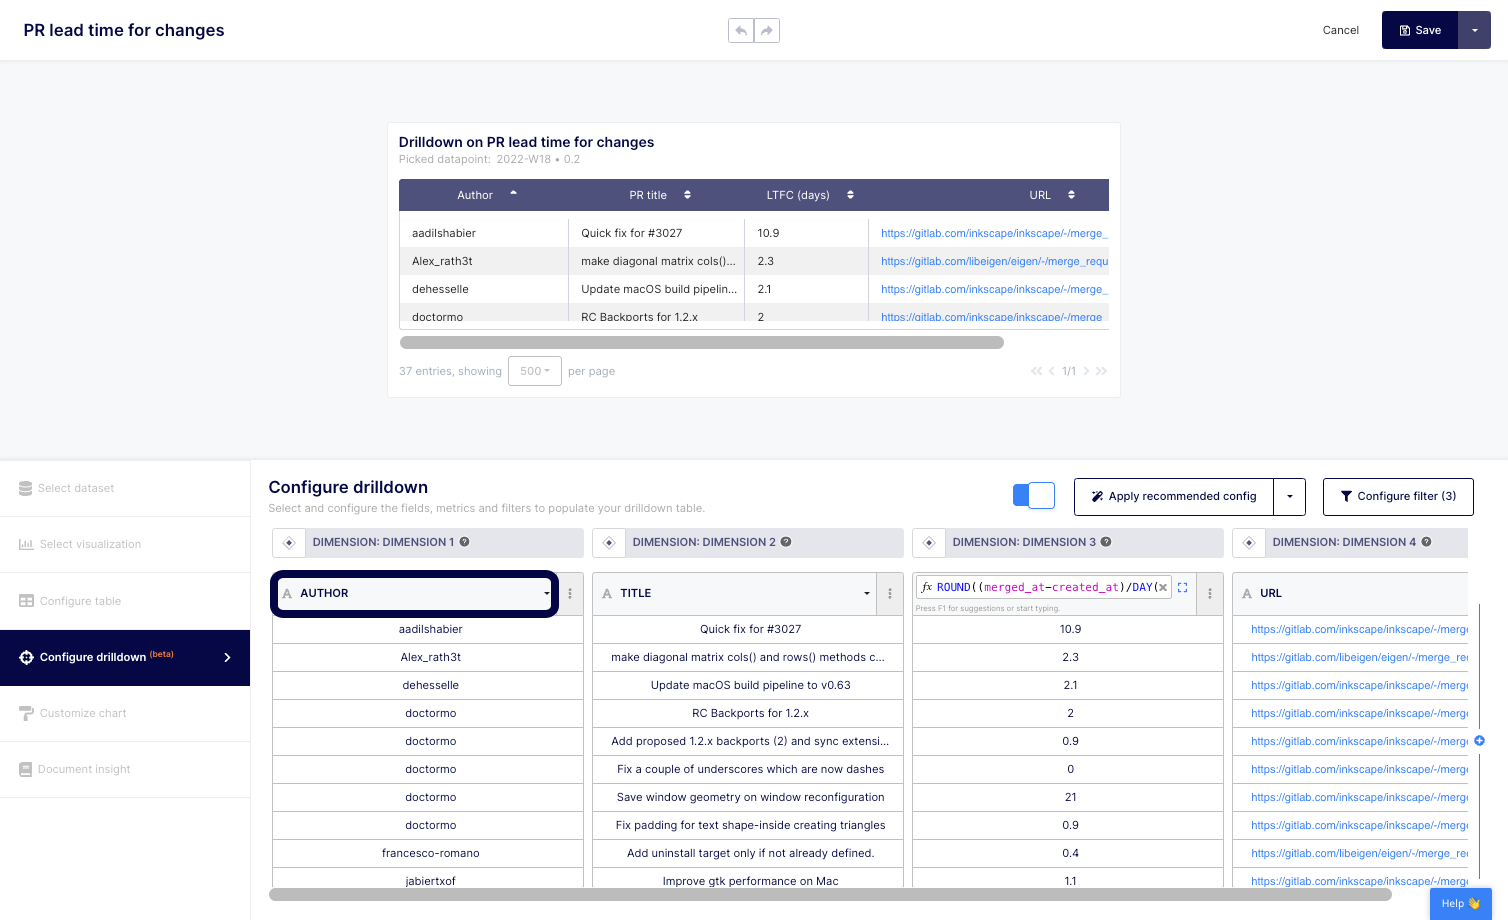
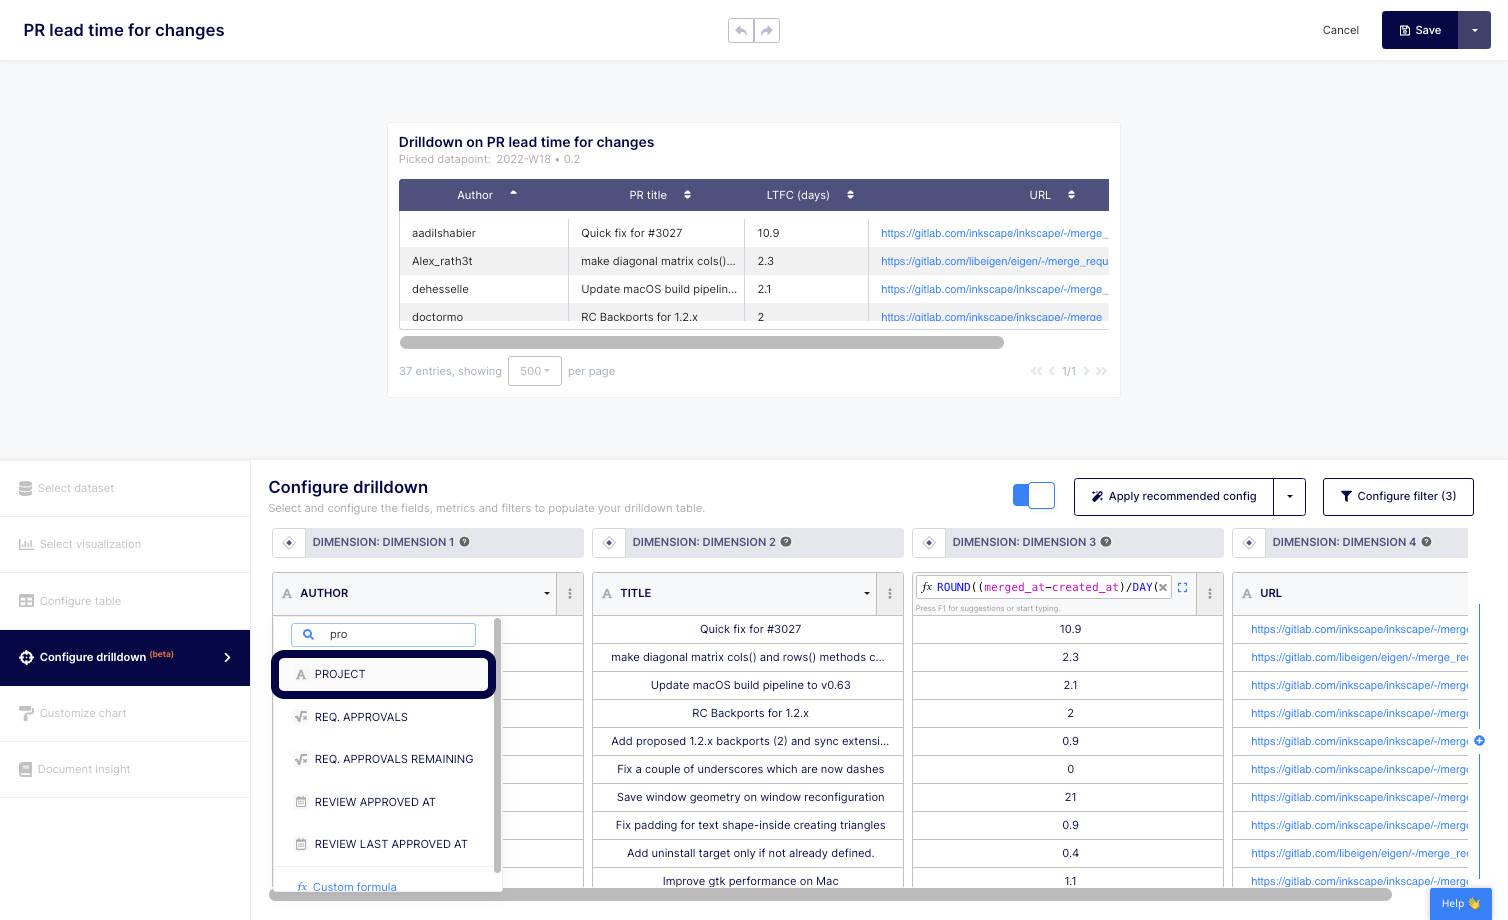
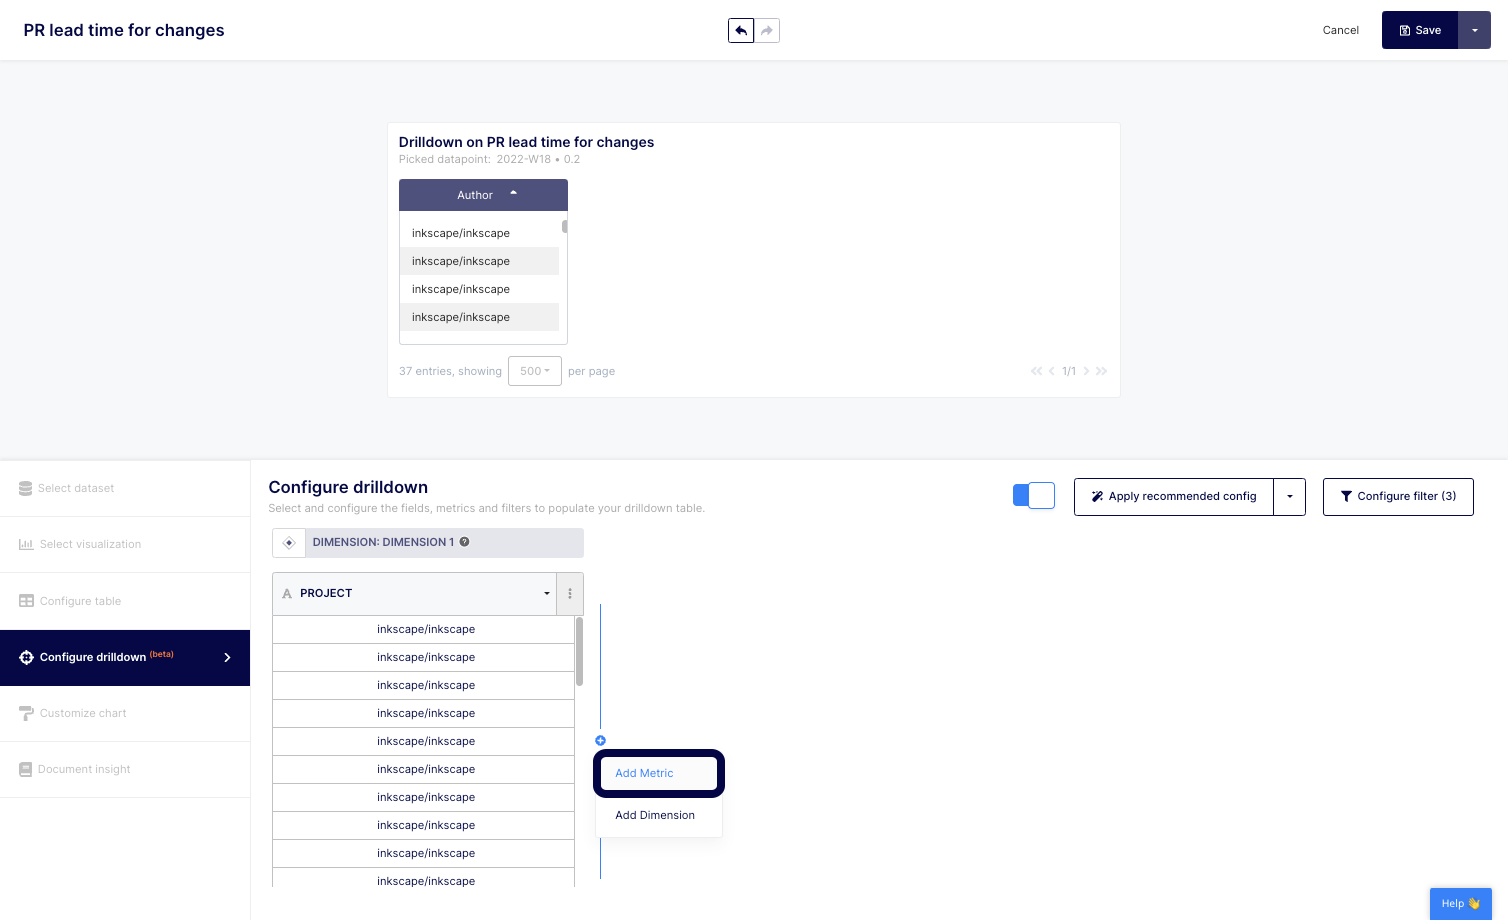
6. To modify a dimension, click on the drop-down menu of the selected field, here "AUTHOR".
7. Type or select the field (or custom formula) you want to explore when clicking on the drill-down. Here, we select "PROJECT".
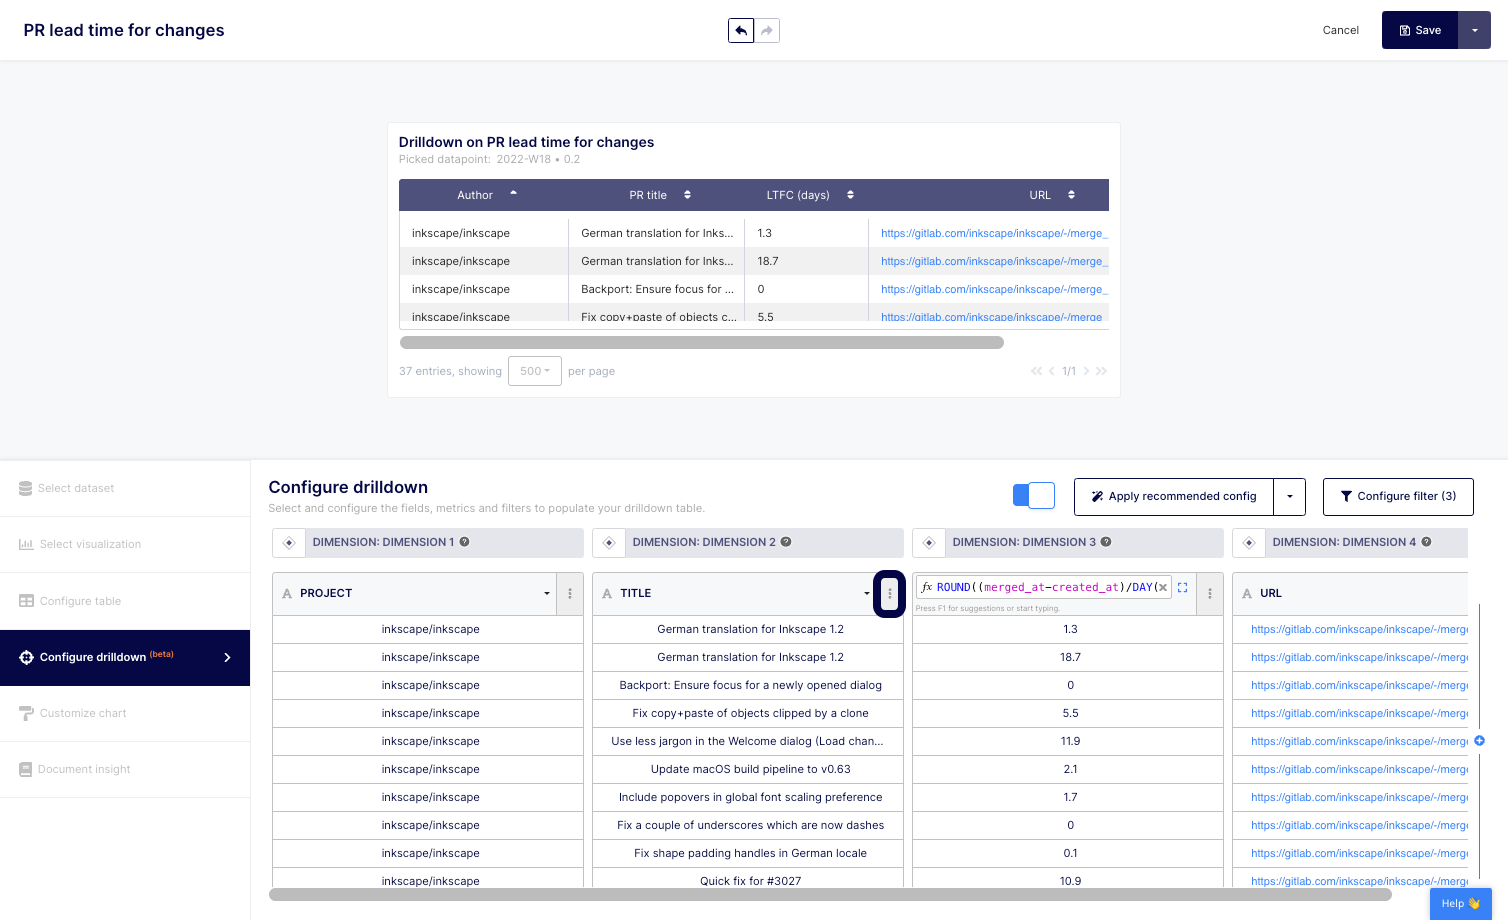
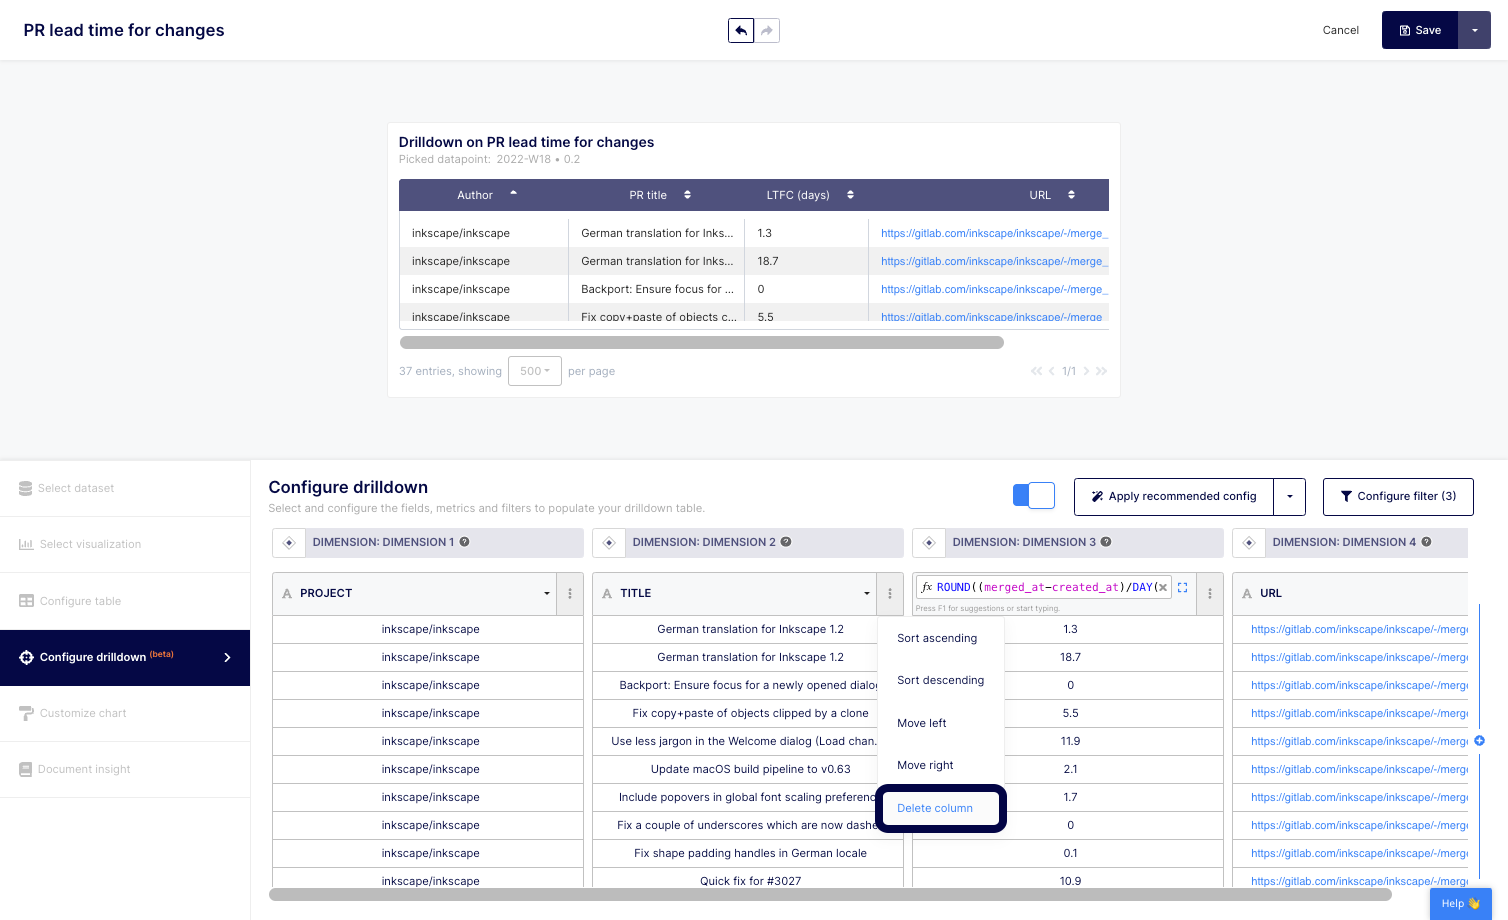
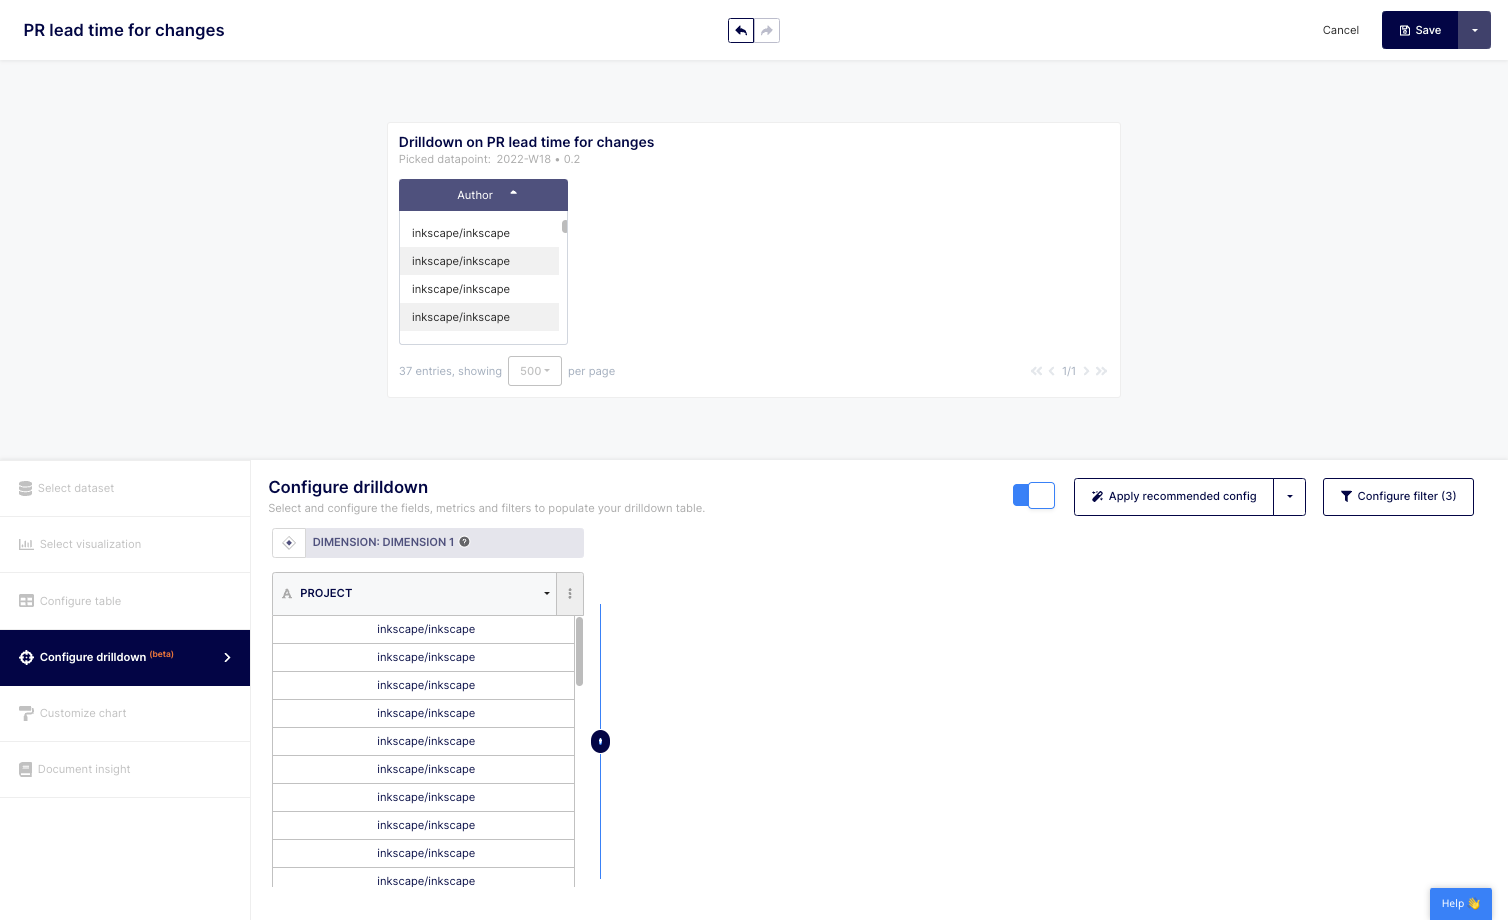
8. You can then sort, delete or add dimensions and/or metrics using the edit button located at the top of each column on the report. You can also reorganize columns to best illustrate your data points.
10. To add a column (metric or dimension), click on the + button located at the right of the column.
11. Then, select "Add Metric" or "Add Dimension". For this example, we'll select the "Add Metric" one.
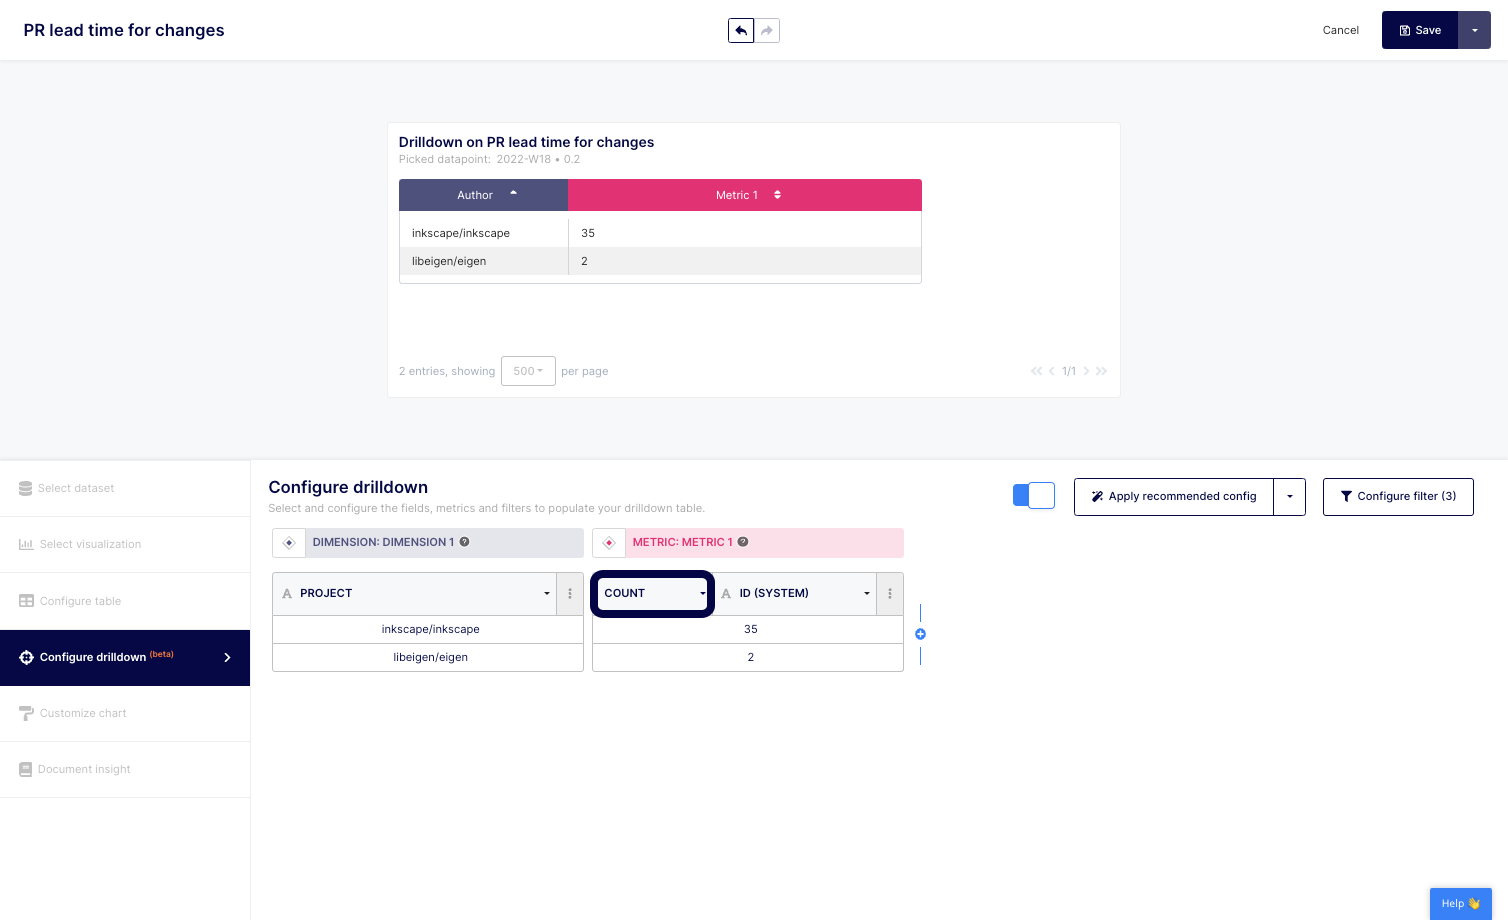
12. Then, click on the dropdown to select the appropriate function.
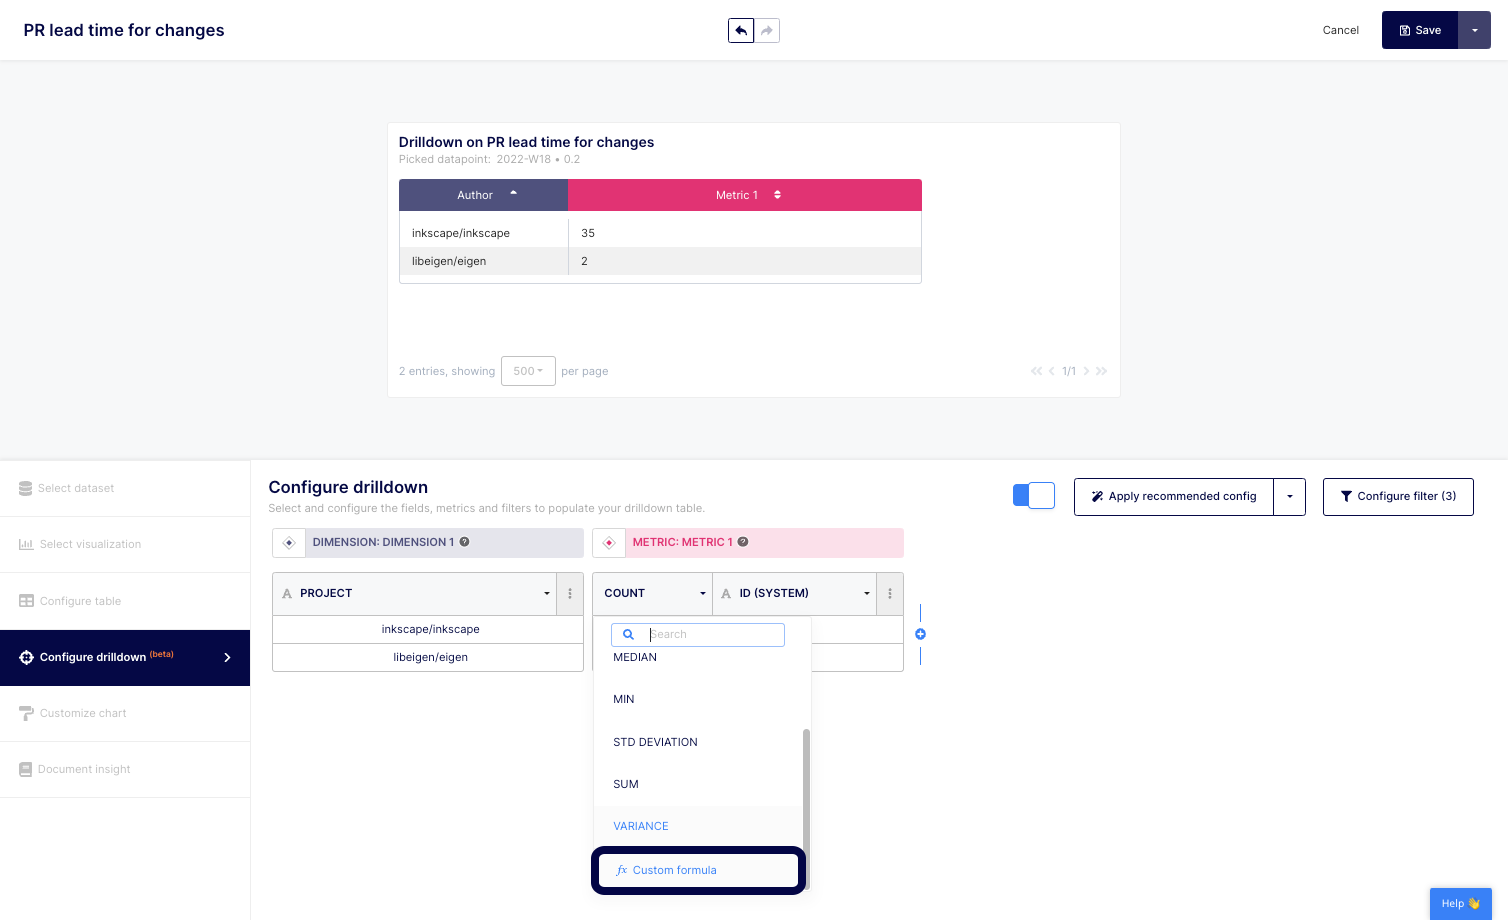
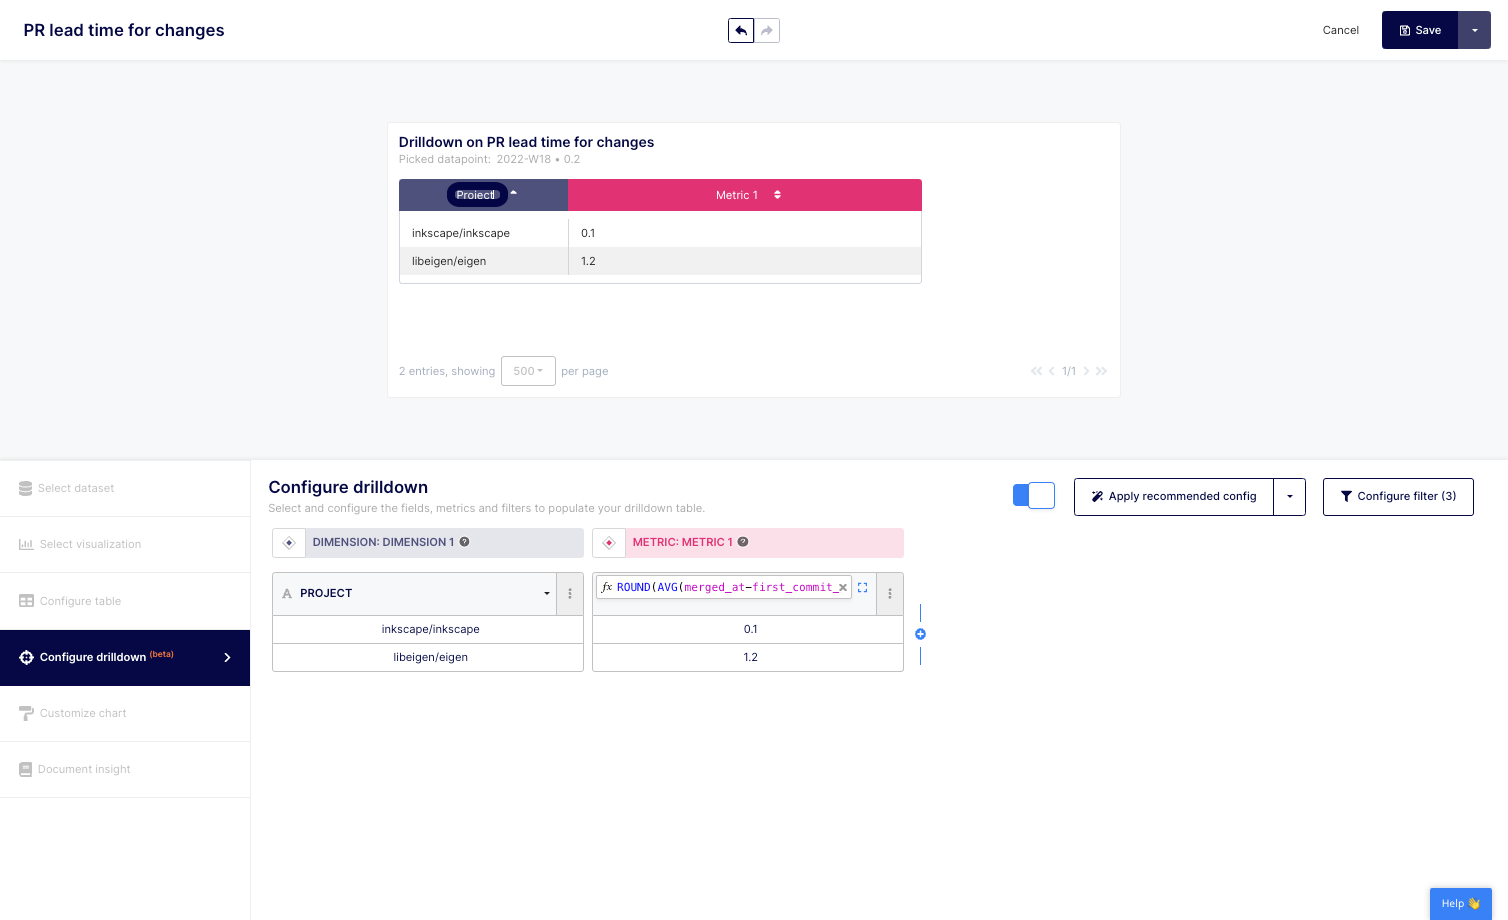
13. Or, select "Custom formula" to build your own metric. Tip: you can always copy a custom formula from the various provided templates if applicable.
14. Don't forget to rename your columns to reflect your data points and/or calculation.
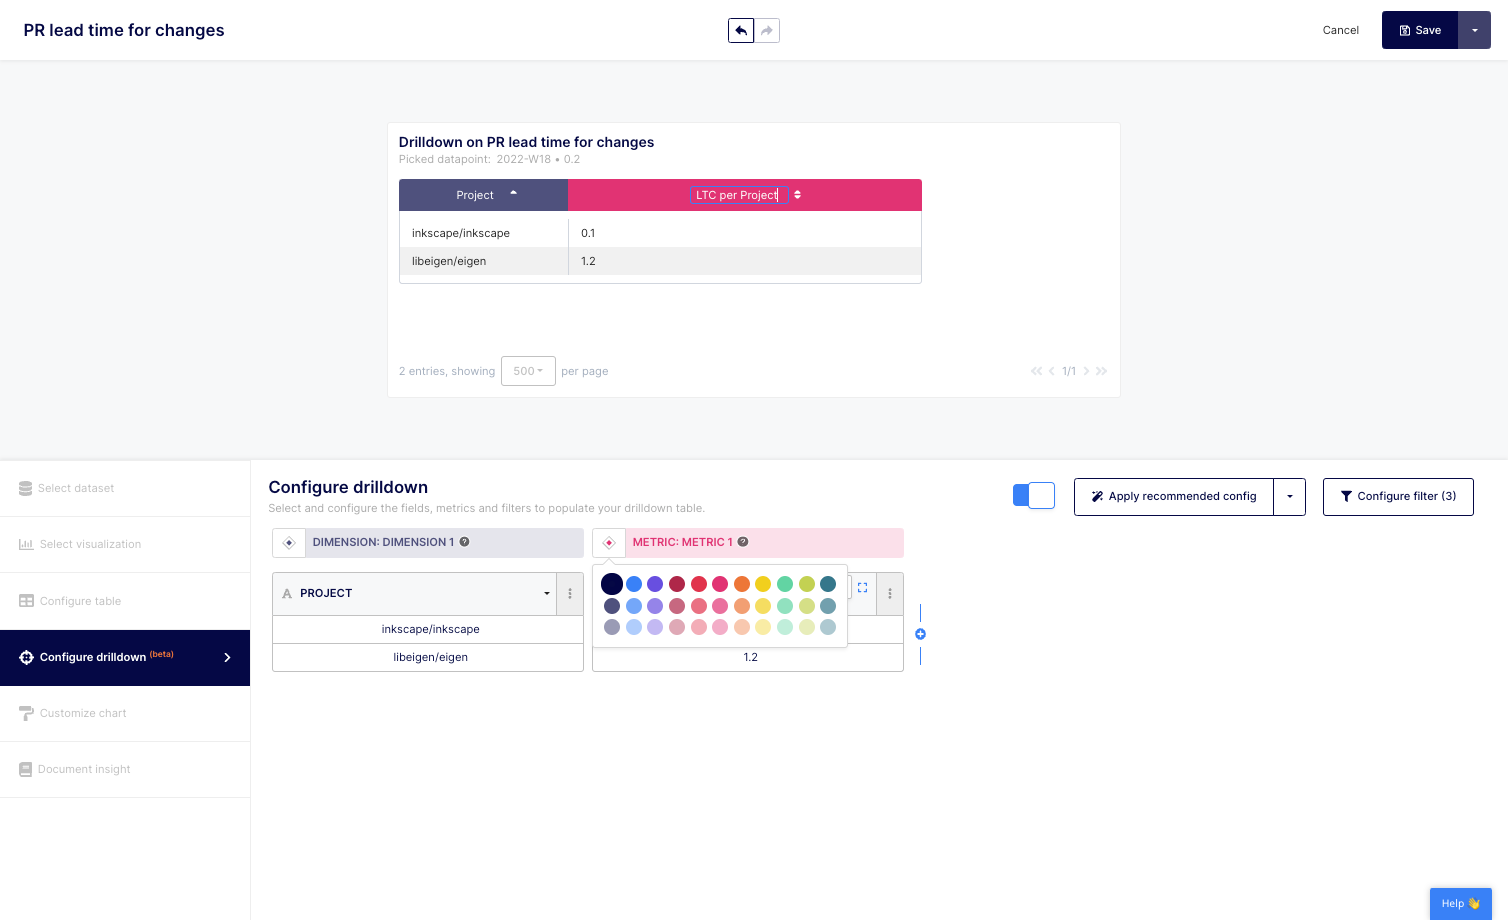
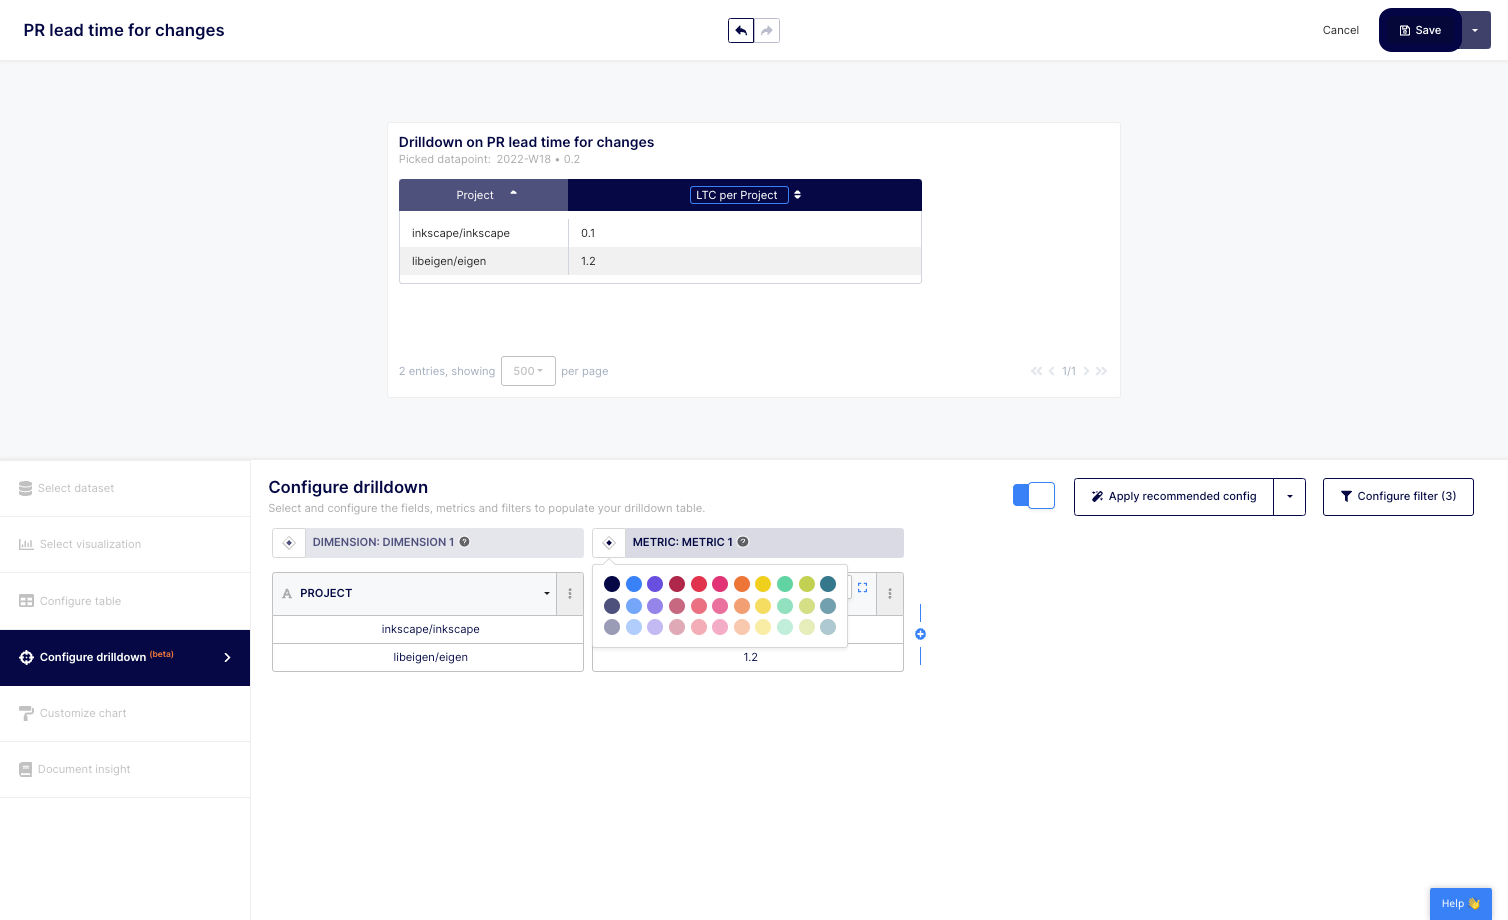
15. You can also modify your column header by clicking on the color button located at the top left of each column.
16. Select the color of your choice.
17. Don't forget to "Save" your drill-down using the top right button.
When creating your own metric, you can also configure your drill-down or apply the recommended configuration to get started.
By exploring engineering metrics details using Keypup's drill-down feature, you can gain a deeper understanding of your organization's performance and identify areas for improvement. Whether you want to analyze individual contributors, teams, specific projects, or other dimensions, Keypup's drill-down feature makes it easy to explore the details that matter to you.
In conclusion, Keypup's drill-down feature is a powerful tool for exploring engineering metrics details that matter. By customizing the drill-down to fit your unique needs, you can gain a deeper understanding of your organization's performance and make data-driven decisions to drive improvements. Try Keypup's platform today to see how you can benefit from using the drill-down feature to explore your engineering metrics details.