As a tech leader, you understand the importance of data-driven decision-making to ensure your team is moving toward your company's goals for success. However, it can be challenging to get started with engineering metrics and KPIs without in-house data engineering and analytics skills. Fortunately, Keypup's metric configuration assistant makes it easy to get started with custom engineering metrics in no time.
Here are the steps to create engineering metrics using Keypup's configuration assistant:
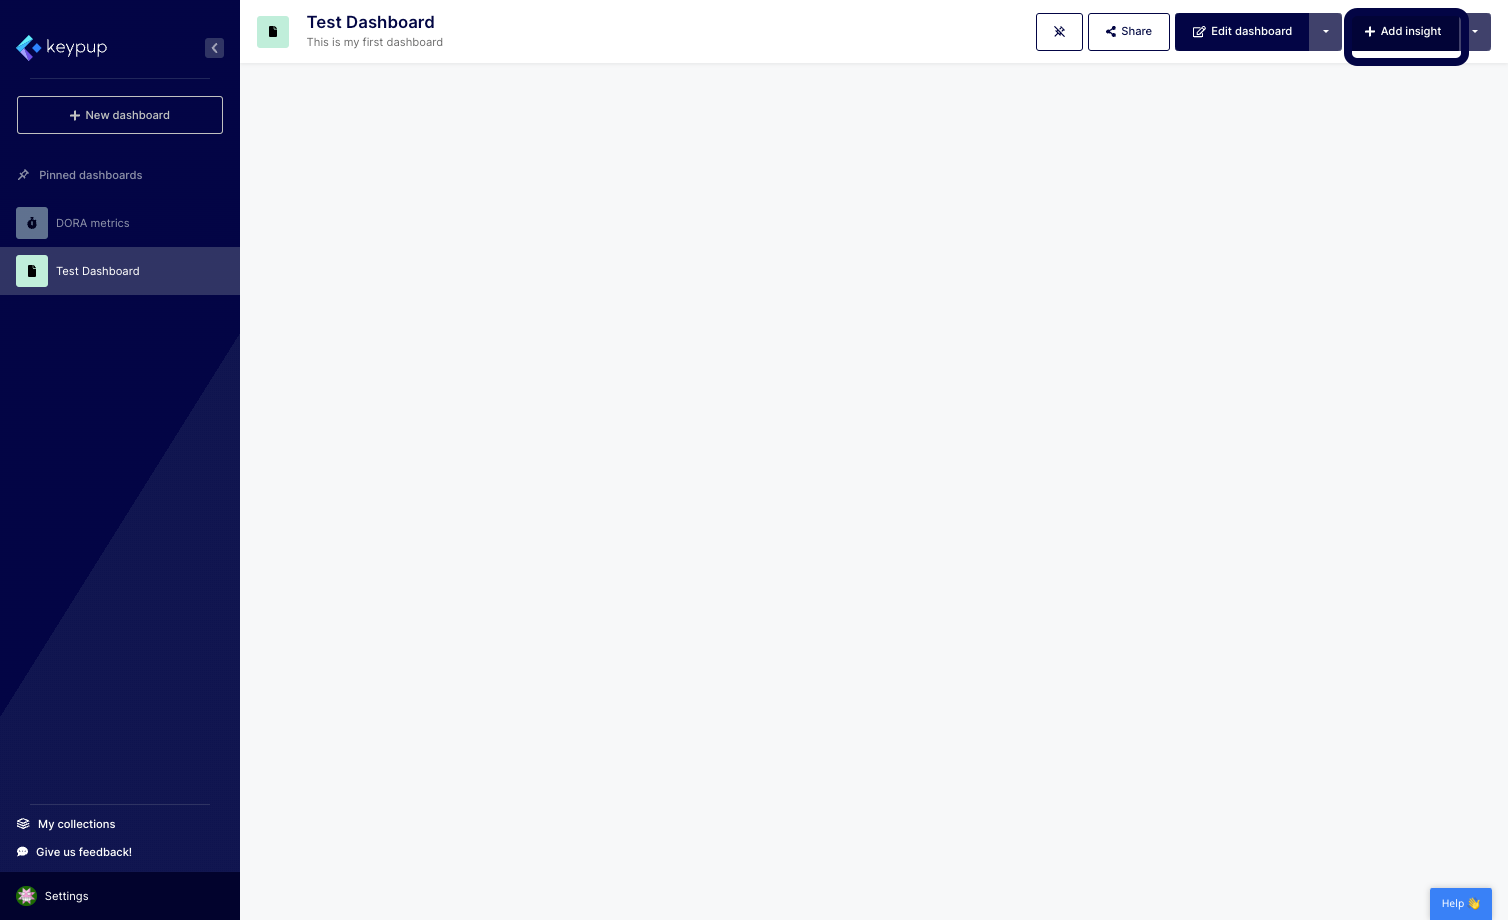
1. Click on the "Add insight" button located at the top right of any dashboard.
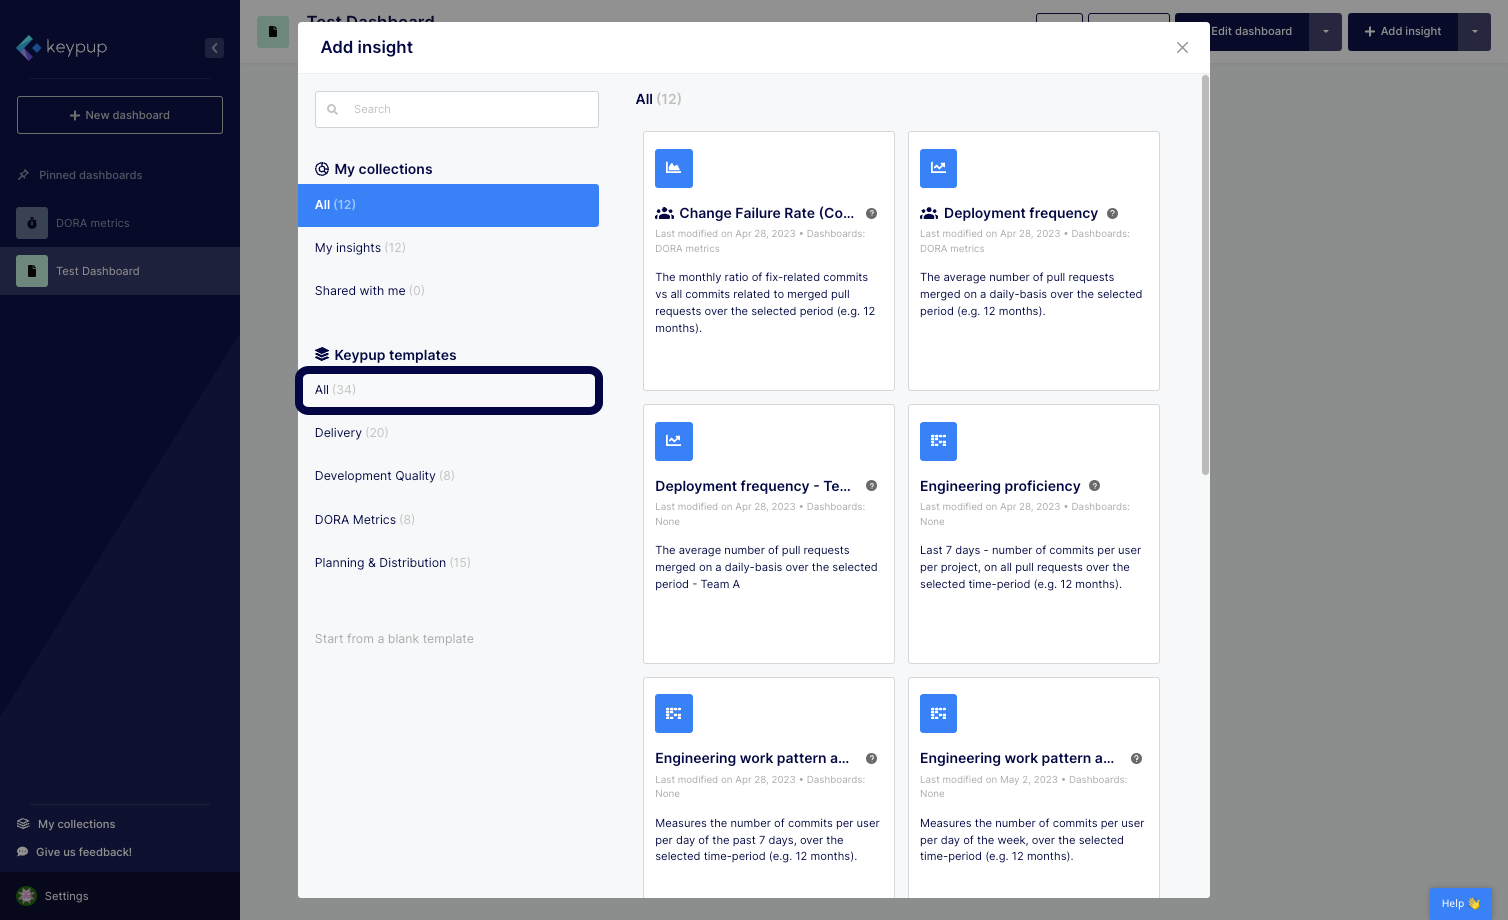
2. Select the Keypup templates option to access the complete Keypup library.
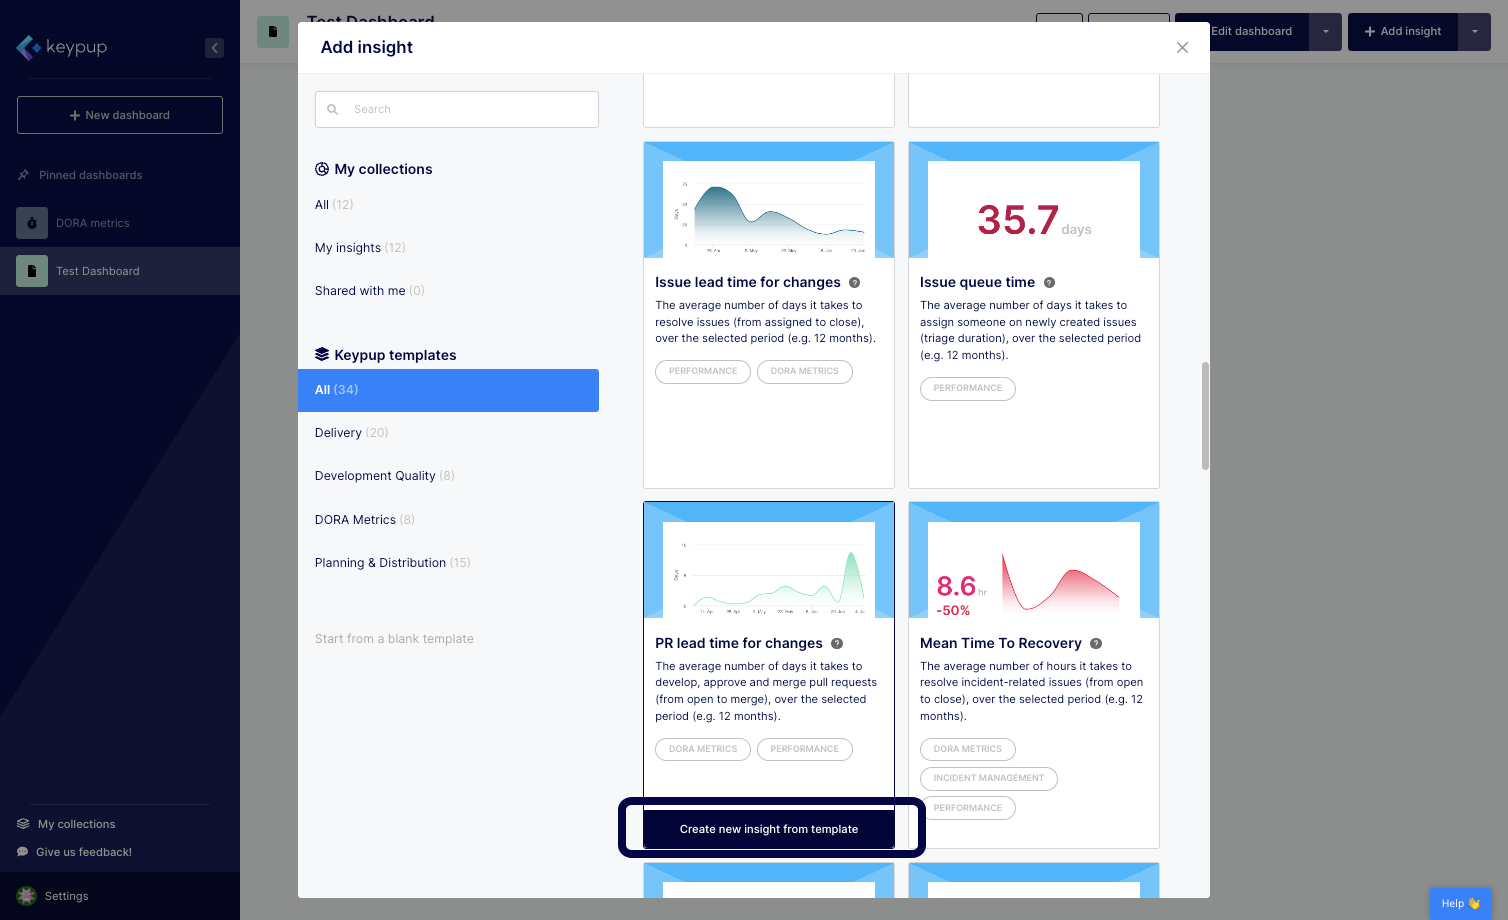
3. Once you find the template you want to adapt, click on the "Create new insight from template" button located below the template of your choice.
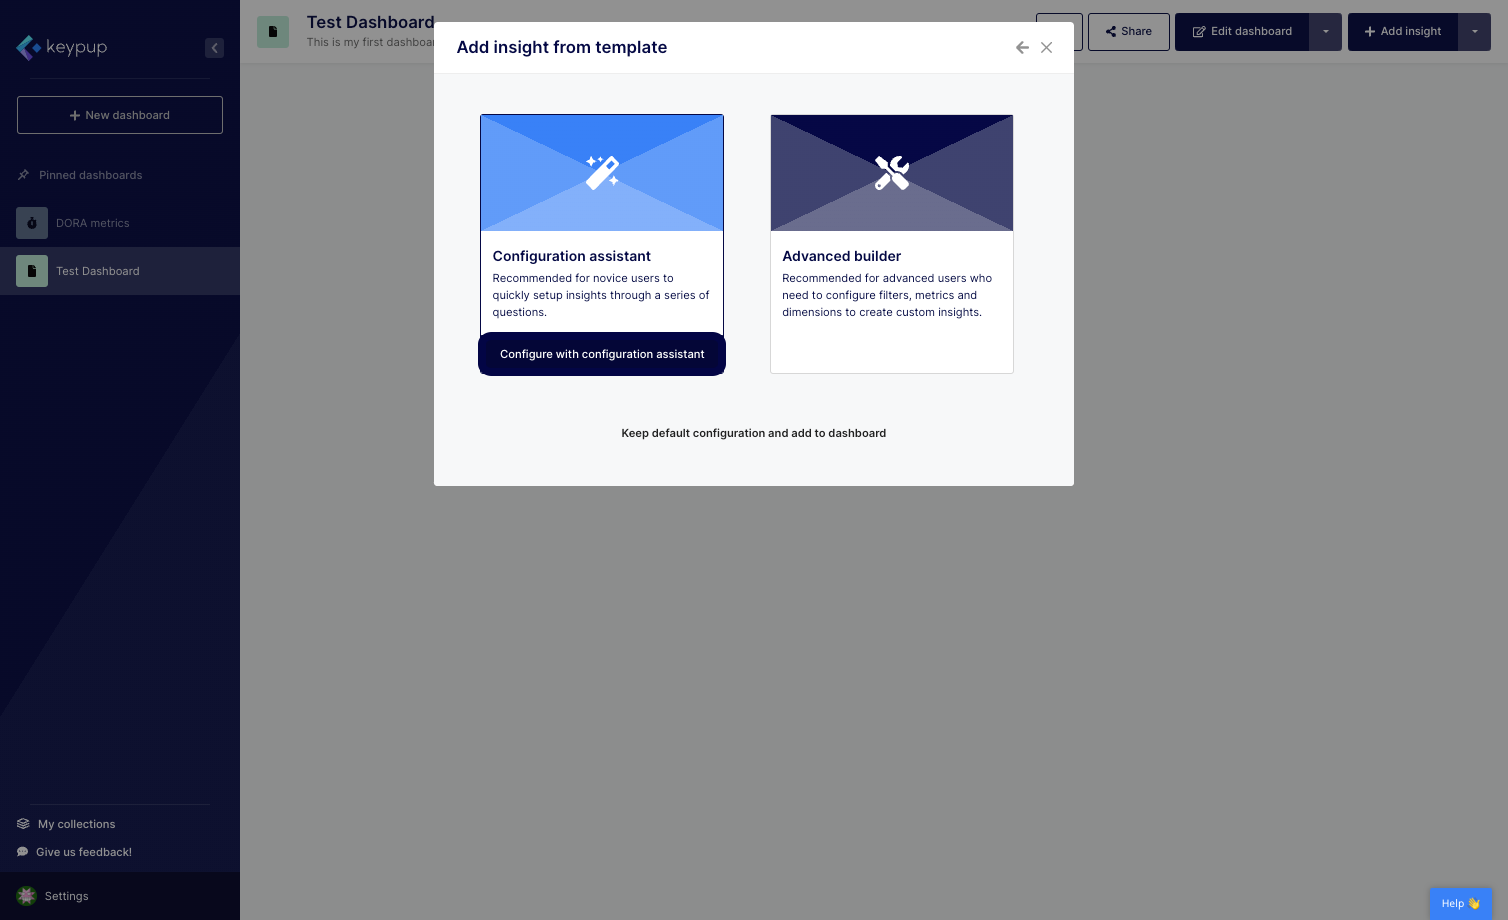
4. Select the "Configure with configuration assistant" button.
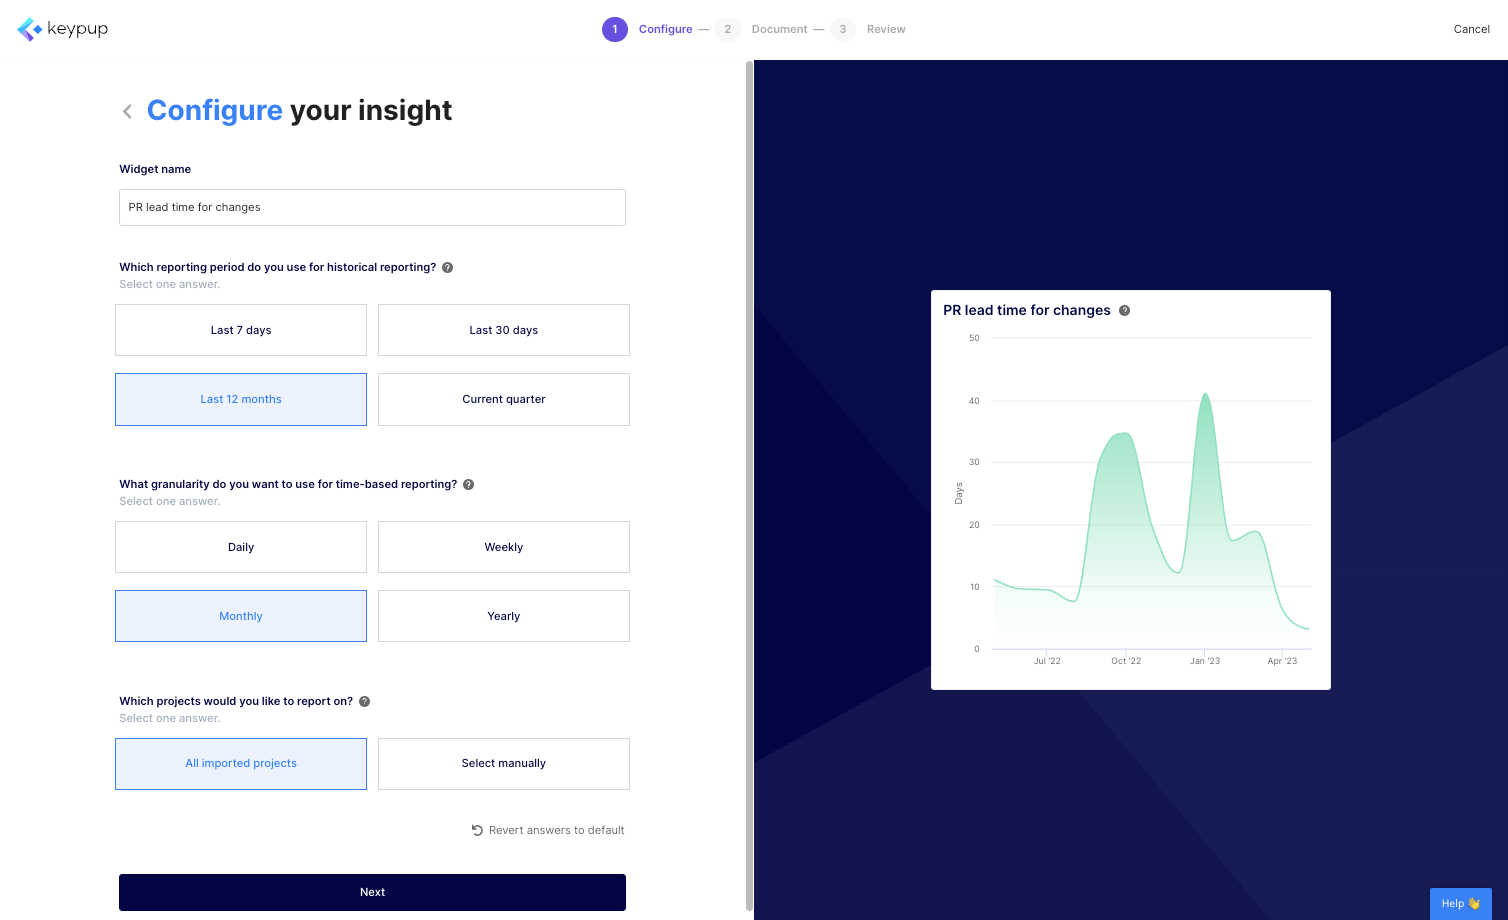
5. The "Configure your insight" step allows you to customize your metric by answering a few questions, such as time frames, projects, or naming conventions. Answer the questions and adapt the insight title accordingly.
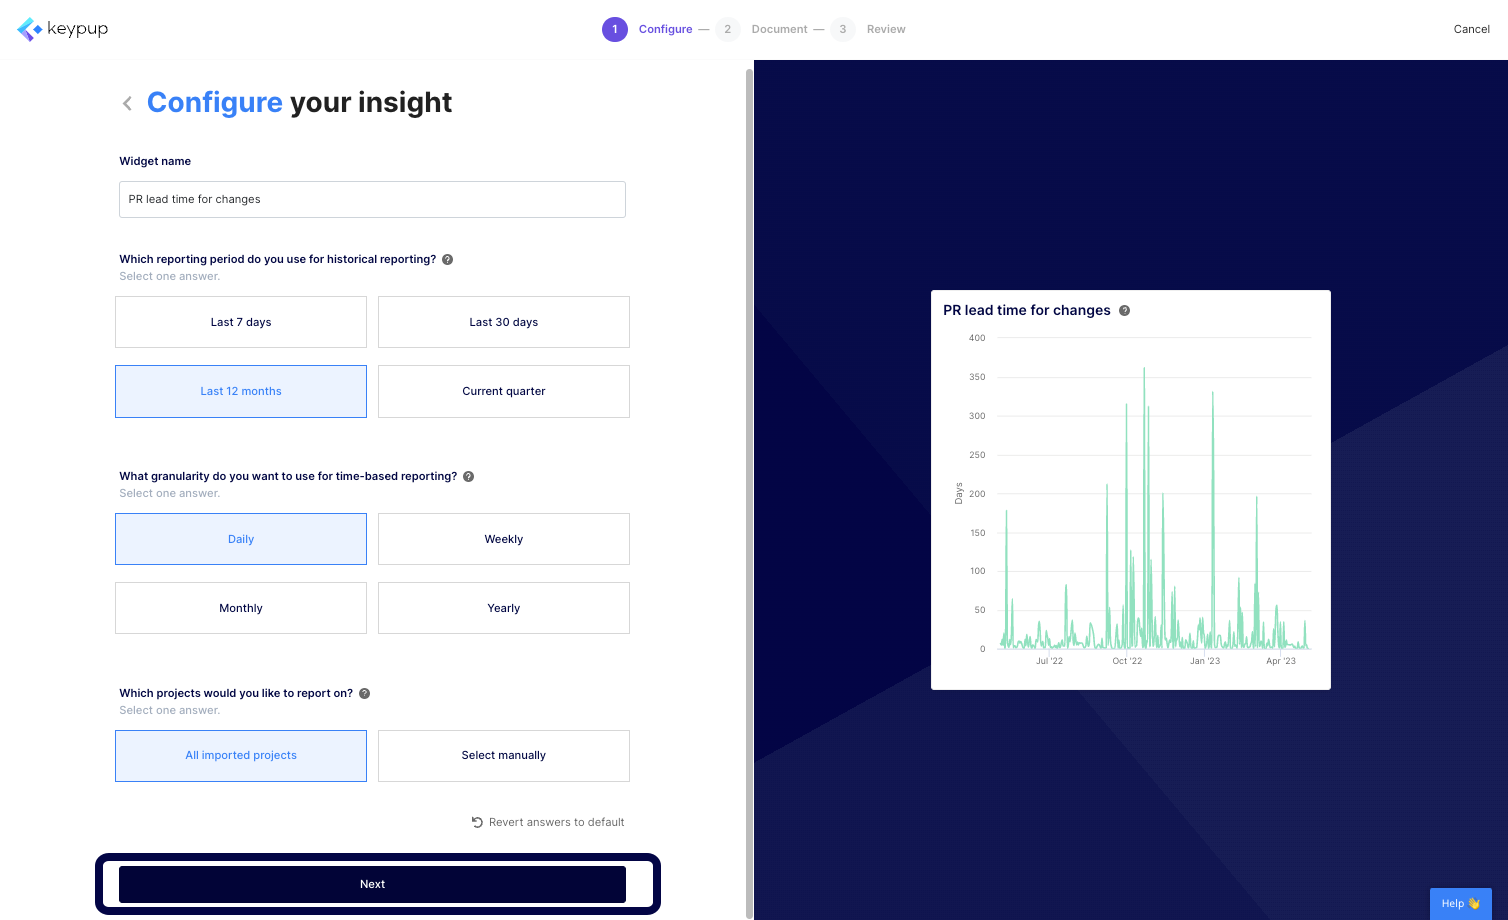
6. Once done, click on the "Next" button at the bottom of the page.
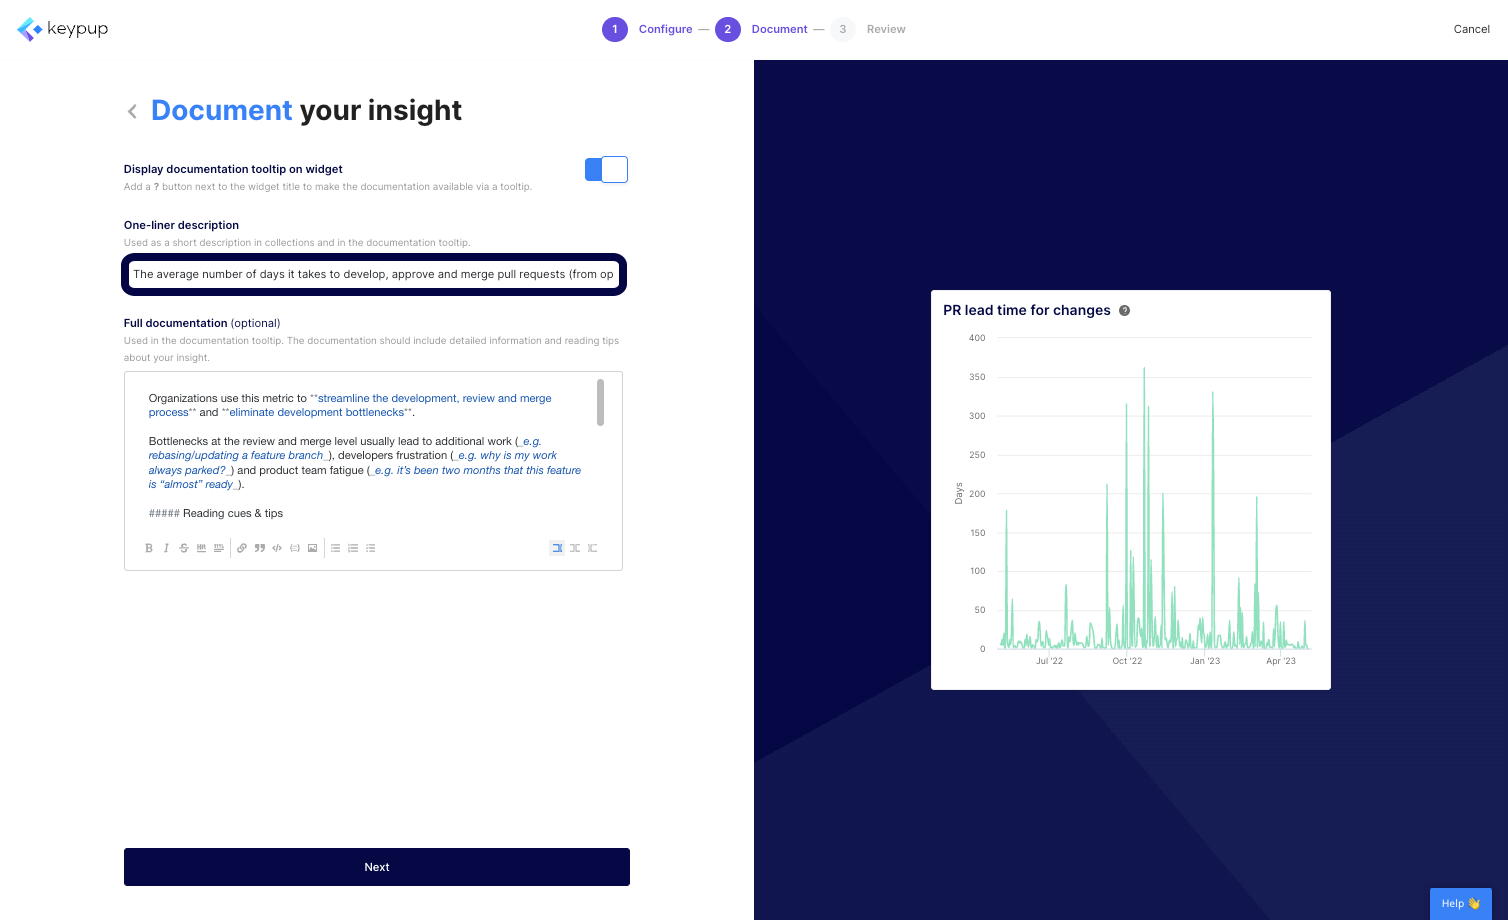
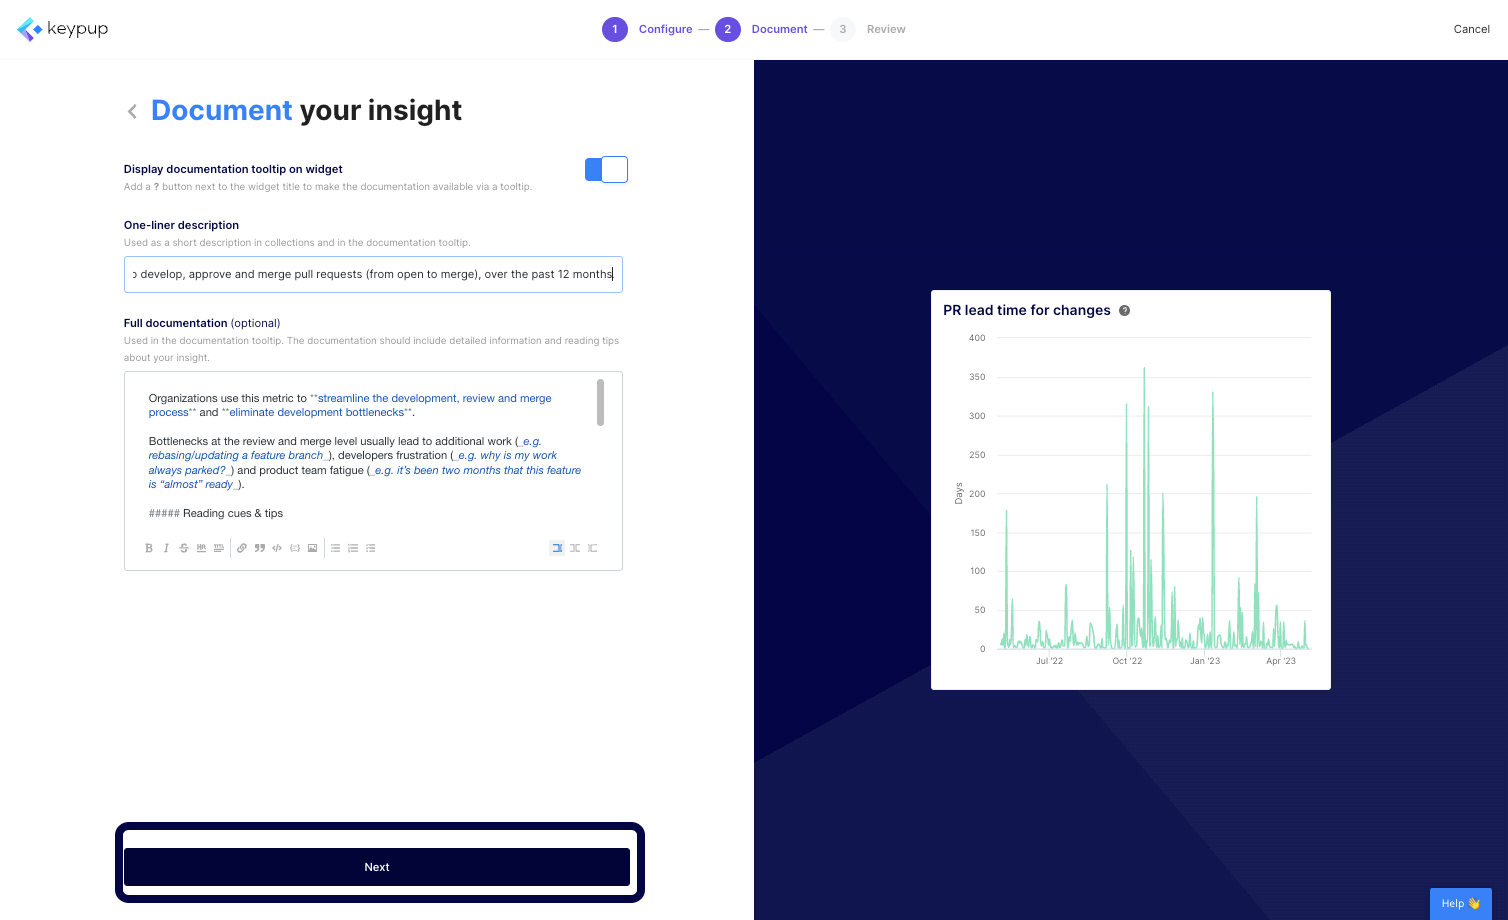
7. The "Document your insight" step allows you to describe your metric and its goal in further detail. You can adapt the pre-built documentation that comes with all templates to reflect your changes or your own processes.
8. Once finished, click on the "Next" button located at the bottom of the page.
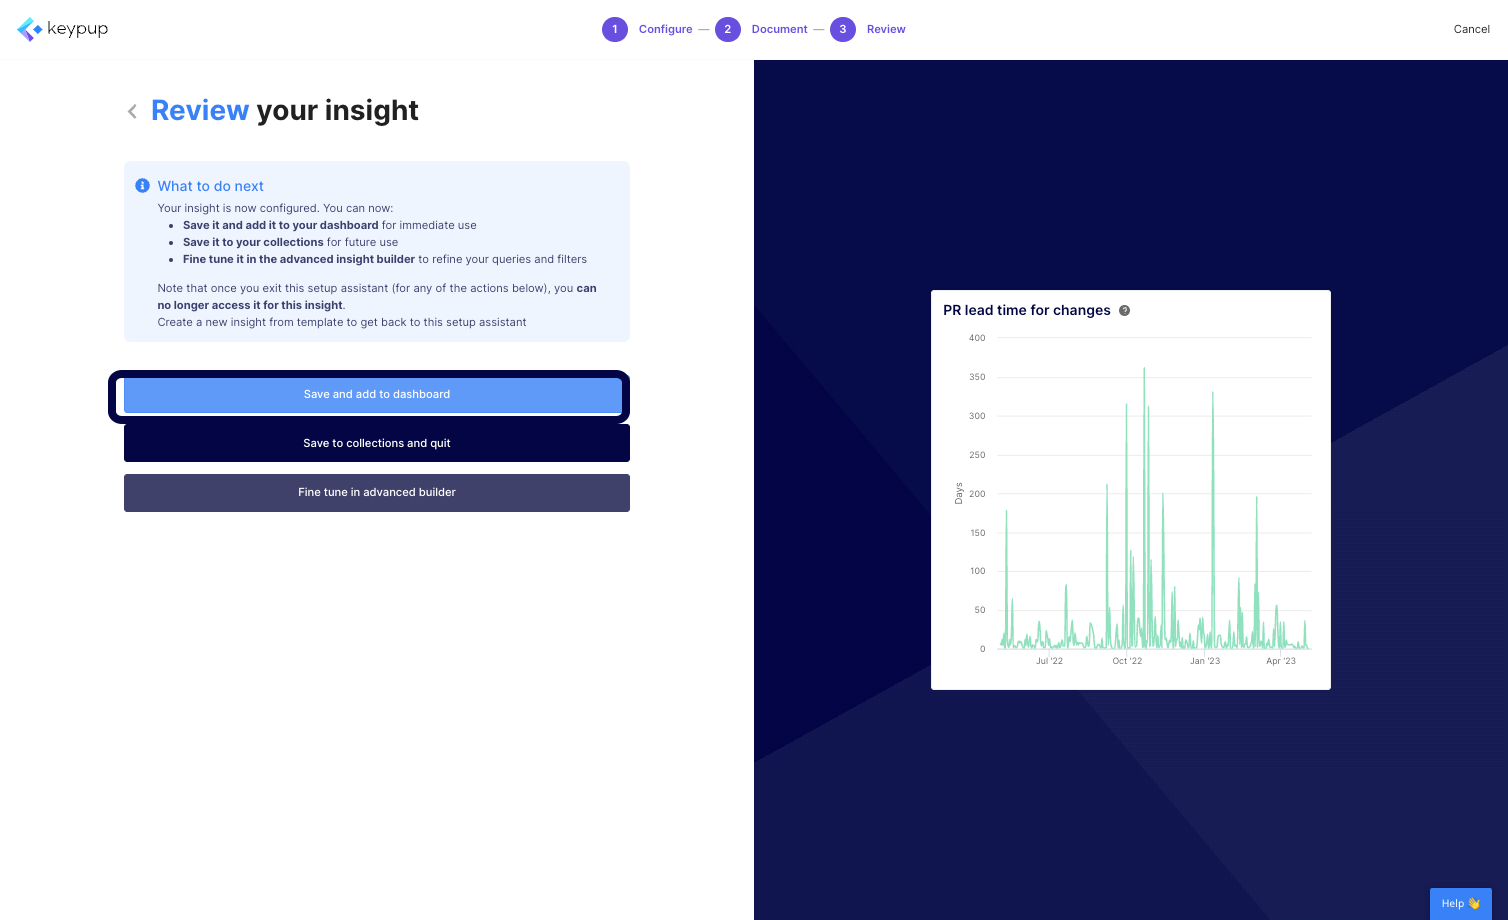
9. Your metric configuration is now finished. You can save and add the metric to your dashboard or collection or fine-tune it using the advanced builder capability. For now, we'll add it to the dashboard.
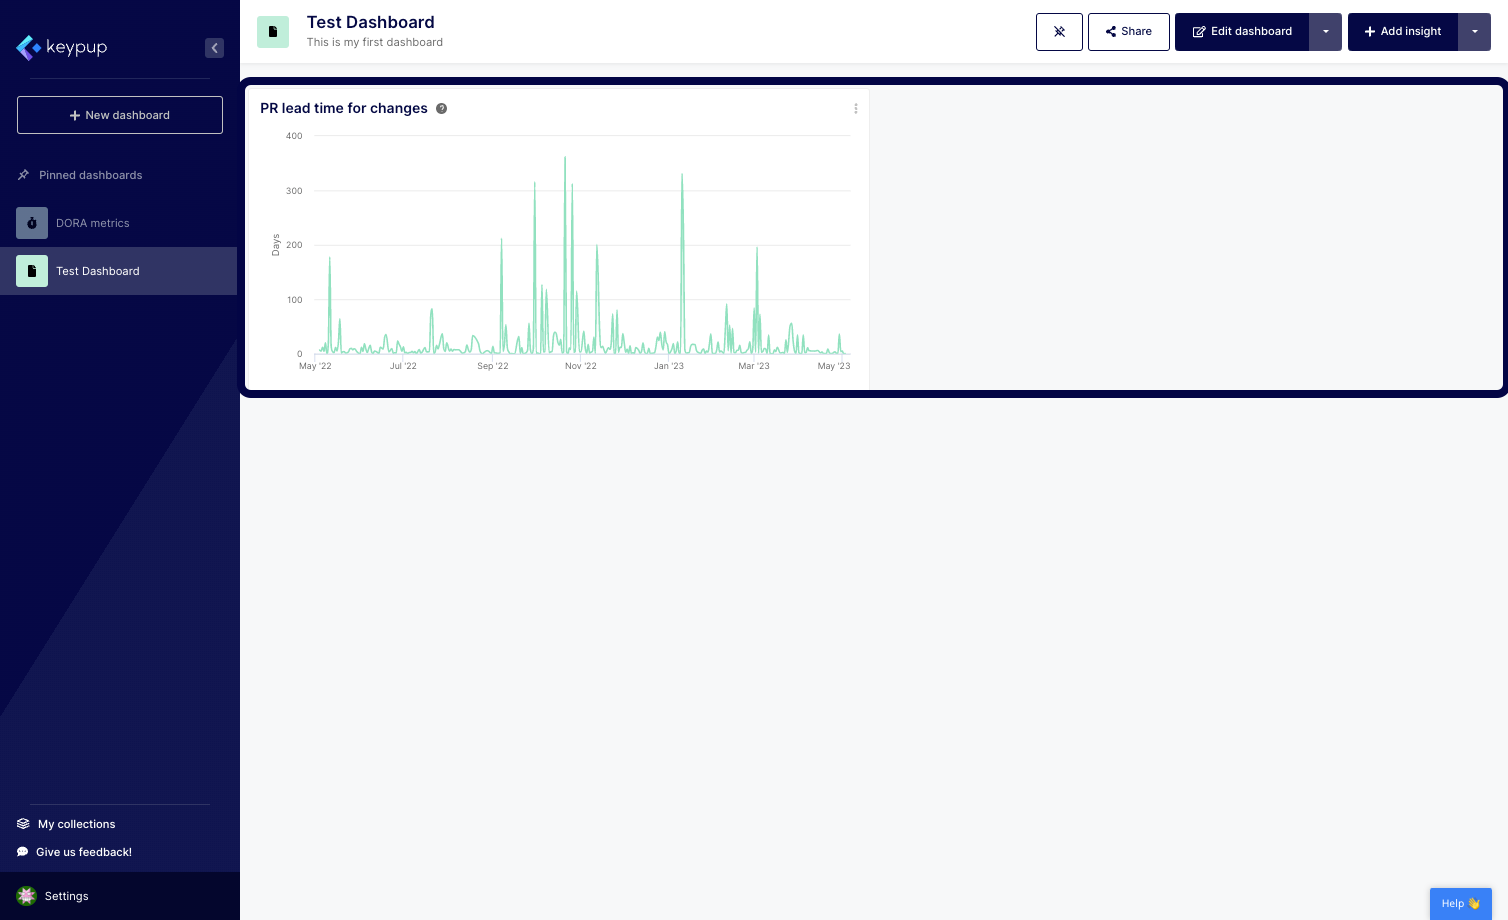
10. You're done! The metric is automatically added to your dashboard.
By leveraging Keypup's configuration assistant, you can quickly and easily create customized engineering metrics without needing a data science Ph.D. By answering a few questions and adapting the insight documentation, you can customize the metric queries and filters to fit your unique needs.
In conclusion, creating engineering metrics in no time using Keypup's configuration assistant is a simple and efficient way to get started with data-driven decision-making. With this powerful tool, you can create custom metrics that meet the unique needs of your team and stakeholders. Try Keypup's platform today to see how you can create customized engineering metrics in no time.