Developing high-quality software quickly has become more important than ever in today's technology landscape. One way to measure the efficiency of your development process is by tracking cycle time, which is the time it takes to deliver a feature, generally (but not only) from ideation to production. By monitoring cycle time and taking actions to improve your development process, you can reduce delays, increase efficiency, and deliver more value to your customers.
In this article, we'll explore the steps involved in calculating cycle time from Git repositories, including how to define starting and ending points, determine the needed data, and interpret the results. We'll also discuss the importance of incorporating metrics and key performance indicators (KPIs) slowly to avoid information overload and the benefits of continuous improvement through monitoring and enhancing cycle time.
We'll provide concrete examples of formulas to calculate cycle time using spreadsheets as well as recommended templates to fetch your code repos and project management (PM) tools’ metadata in real time to get started. We’ll also offer guidance on how to interpret cycle time data and take action to improve your development process. Finally, we'll explore additional metrics that can provide more granular information about your development process and identify areas for improvement.
By following these best practices for calculating and analyzing cycle time, you can continuously improve your development process and deliver more value to your customers.
Choosing the Right Starting and Ending Points for Your Cycle Time Calculation
The starting and ending points of your cycle time calculation define the boundaries expressed in timestamps of the process you're measuring.

Here are some options and their pros and cons:
Cycle Time from the Time a Task Is Added to the Backlog to When It Is Closed
Pros: This captures the entire development process, from ideation to execution.
Cons: It requires perfect backlog grooming and usage of the issues and ticketing systems, meaning that the ticket creation process shouldn’t be used as a brainstorming tool. In addition, the team should use auto-closing keywords at a pull request (PR) level to ensure the issue is closed automatically when the PR is merged. Alternatively, the team needs to be proficient at closing a ticket once the work is done.
Cycle Time from the Time a Task Is Assigned to a Developer to When Its Associated PRs Are Merged
Pros: This focuses on the development portion of the process and excludes any time spent in the backlog, providing a view of software development effort.
Cons: It may be difficult to accurately define when a task is assigned to a developer, and it does require proper usage of auto-closing keywords to link issues to PRs. In addition, it requires proper assignment of rules – meaning the team should avoid assigning tasks to themself after they’ve completed them.
Cycle Time from the Time a PR Is Created to When It Is Merged
Pros: This focuses specifically on the PR process, which is where you could identify most of the bottlenecks, such as the review process.
Cons: It may not capture all the work that went into the task before the PR was opened (e.g., design work, assignment, etc.) or after it was closed (end-to-end testing, product-side validation, etc.).
Cycle Time from the Time a First Commit Is Made to When the PR Is Merged
Pros: Similar to the PR cycle time – this version is a more granular view of actual software development effort. It helps understand when the work actually started (PR opened versus first commit).
Cons: It doesn’t capture all the work that went into the task before the first commit was made.
Cycle Time from Commit Creation to Merging in the Production Branch
Pros: This focuses specifically on the time it takes for individual code contributions to reach production (modulo deploy time), which can be a critical metric for development and product teams.
Cons: It does not capture the actual deploy time, only the development, testing, validation, and launch to production cycle time. This view is per commit, which gives a higher variance than a per pull request view due to the time spent in development between two commits.
Ultimately, the choice of starting and ending points will depend on your goals and the specific processes you want to measure. Consider the pros and cons of each option and choose the one that best suits your needs.
When calculating cycle time from Git repositories, it's important to distinguish between the data that you need and the data that is available. Here are some tips on how to make the best choices:
Define Your Needed Data Points to Calculate Cycle Time
Start by defining what you want to measure and what data is needed to calculate cycle time. For example, if you want to measure the time it takes to complete a specific task, you need to track when the task was added to the backlog (the issue created date) and when it was completed (often when the issue is marked as “done”). You also need to think about alternative data points, in case the chosen ones are not easily retrieved from your systems or if your process is either not clearly defined or properly applied. A concrete example we’ve observed is users working on PRs and assigning the related tasks (e.g., Jira ticket) to themselves after the code was merged.

Identify Available Git Data to Calculate Cycle Time
Next, identify what data is available in your Git repository. This may include information on commits, pull requests, issues, and other events. You may also need to consider how this data is structured and stored. Additionally, as detailed previously, you need to gauge the amount of data that could be extracted from your system based on each preferred data point and alternatives if the datasets are inconsistent.
Assess Available Data Quality
Even if the data you need is available, it may not be complete or accurate. For example, some events may not be tracked in the repository or may be recorded incorrectly. Assess the quality of the available data and determine whether it can be cleaned and used for your purpose.
Consider Additional Data Gathering Cost
If the available data is incomplete or inaccurate, you may need to gather additional data from other sources (like your ticketing system, for instance). However, this can be costly in terms of time and resources. Consider the trade-offs of gathering additional data versus using the available data.
Determine Relevant Data Points
Once you have assessed the quality of the available data and considered the cost of gathering additional data, determine what data is most relevant to your goals. This may involve prioritizing certain types of events (e.g., pull requests over commits) or filtering out irrelevant events (e.g., events related to non-development work). This means that if some data points are missing (e.g., assignment date), you may want to consider the closest available option (e.g., first commit date).
By following these steps, you can make informed choices about the data you need to calculate cycle time from Git repositories. Remember to balance the available data with the data you need, and consider the quality and relevance of the data in making your choices.
How to Manually Fetch Data from a Git Repository to Calculate Cycle Time
Here is a step-by-step guide to help you extract data from your repository using Git command lines and APIs:

Fetching Data Using Git Command Lines (Commit Statistics)
- Identify the repository: First, identify the Git repository that you want to extract data from. You'll need to have read/checkout access to the repository.
- Clone the repository: If you haven't already, clone the repository to your local machine using the command git clone <repository URL>.
- Check out the target branch: Switch to the branch that you want to extract data from using the command Git checkout <branch name>. For example, “git checkout production” if you need statistics about commits that made it to production.
- Identify the relevant events: Identify the types of events that are relevant to your cycle time calculation. For example, you may want to exclude “Merge” commits if you want to calculate a cycle time on development commits
- Extract the event data: Use filtering and formatting commands in Git to to extract the relevant event data.
*For example: ***To extract commits for a specific author: git log --author=<username> --pretty=format:"%h %s %cd" --date=iso To refine this list to “fix” commits: git log --grep=”fix” --author=<username> --pretty=format:"%h %s %cd" --date=iso To show the relative commit date (e.g., 2 hours ago): git log --grep=”fix” --author=<username> --pretty=format:"%h %s %cd" --date=relative This last command – when used on the production branch – is useful to quickly get the cycle time of commits, from development to production.
- Clean your data: Once you have extracted the relevant event data, you may need to process it further to calculate cycle time. For example, you may need to filter out irrelevant commits by restricting your reporting to “feat” (feature) or “sec” (security) commits.
Fetching Data Using the APIs of GitHub, GitLab, or Bitbucket

- Identify the repository: Identify the repository you want to fetch data from. You will need read access to the repository to extract data and admin access if you wish to receive real-time updates via webhooks.
- Read their API documentation: GitHub, GitLab, and Bitbucket all have detailed documentation about their API, allowing you to retrieve pull requests and commits.
- Fetch pull request data: Using their REST API and a bit of scripting (e.g., Ruby, Node.js, etc.), fetch all recent pull requests and store the result as a JSON document on your computer. You may want to time-restrict the pull requests you fetch to limit the volume of data. All three Git platforms support timestamp filtering on their API.
- Fetch commit data: For each pull request fetched and stored in your JSON document, use the API to fetch the associated commits. Store each set of commits in a file that identifies the pull request by ID.
- Generate CSV stats from your JSON documents: Now that you have data locally, you can use a script that loops over pull requests and calculate cycle times using the pull request attributes (e.g., created_at, merged_at) and the commit attributes (e.g., created_at of the first commit). These calculated attributes can be output in a CSV file, one line per pull request.
- Visualize your CSV file: After generating these calculated attributes for each pull request, you can sort/arrange/visualize these data using Google Sheets or Excel.
By following these steps, you can manually extract data from a Git repository and clean it up to have it ready for your cycle time calculation. However, this process can be time-consuming and error-prone, so using a tool specifically designed for this purpose is recommended.

Here are some examples of formulas that you can use in Google Sheets to calculate cycle time using different starting and ending points. The timestamp attributes below assume that you have manually correlated issues (e.g., coming from Jira) to their associated pull request(s) and commit(s) (e.g., in GitHub):
First, let’s assume the following columns (fields):
- A: Issue Created Date
- B: Issue Closed Date
- C: PR Merged Date
- D: Issued Assigned Date
- E: PR Open Date
- F: First Commit Date
Now, let’s dig into the formulas:
- Formula to calculate cycle time from the time a task is added to the backlog to when it is closed: =IF(ISBLANK(B2), "", B2-A2)
- Formula to calculate cycle time from the time a task is assigned to a developer to when it’s associated PRs are merged: =IF(ISBLANK(D2), "", C2-D2)
- Formula to calculate cycle time from the time a PR is opened to when it is merged: =IF(ISBLANK(C2), "", C2-E2)
- Formula to calculate cycle time from the time a first commit is made to when the PR is merged: =IF(ISBLANK(C2), "", C2-F2)
Once you’ve calculated the cycle time, you will need to pivot your table to group and filter information in the most meaningful way (timeframe, teams, projects, etc.). In addition, you will need to calculate the average cycle time and how this value is trending over time (using a line chart preferably).
Note that these formulas assume that the relevant data (e.g., dates for when a task was added to the backlog or when a pull request was merged) is already available in the sheet. You may need to modify these formulas to fit your specific use case and columns.
Cycle time is a crucial metric for engineering teams to measure the efficiency and effectiveness of their development process. However, manually calculating cycle time from a Git repository can be time-consuming, error-prone, and outdated. Fortunately, there are tools available, such as Keypup, that can automate this process and provide more accurate and up-to-date information.
Using a tool like Keypup ensures that the data is structured and updated in real time, providing a more accurate representation of the development process. Additionally, Keypup's data visualization and drill-down features allow teams to easily identify bottlenecks and areas for improvement in their development process, leading to a more efficient and effective workflow.
Below are some examples of formulas that you can use in Keypup to calculate cycle time using different starting and ending points.
First, let’s list the fields we will be using for this specific example to calculate cycle time (Note that many other fields, timestamps, and functions are available for your most exotic calculations):
- created_at: the created at field exists on all datasets in Keypup. To measure it at an issue level, you need to select the Issue & Pull Request dataset and apply a filter to your insight to see only issues. For the PR created date, you’ll need to use the same field but apply a filter at a PR level only.
- assigned_at: the “assigned at” field is calculated by Keypup. It recognizes the assignment event at an issue or PR level. It can be calculated by Keypup from the moment the user’s data has been first connected to the platform – which means no historical events (prior to Keypup signup) can be tracked.
- closed_at: the “closed at” field can refer to both issues and PRs (equal to merged_at if the PR was merged). To focus on the issues only, you need to apply a filter to select issues only on your metric.
- first_commit_at: the “first commit at” field populated in Keypup is based on the first commit created date. In this specific calculation, you’ll be able to look at the first commit of the associated merge PR.
- merged_at: the “merged at” field populates the date and time of the PR merged event.
Calculating Cycle Time Using Issues and Pull Requests Dataset
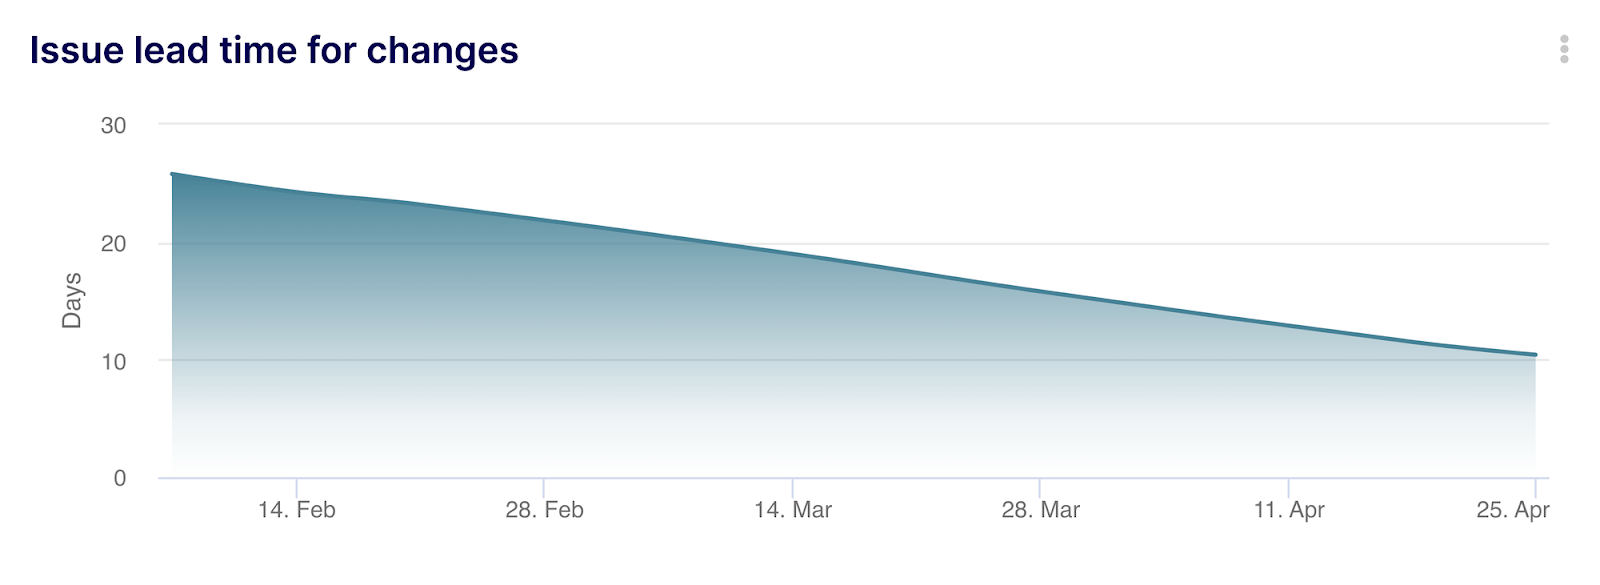
- Formula to calculate cycle time from the time a task is added to the backlog to when it is closed: ROUND(AVG(IF_NULL(closed_at,NOW())-created_at)/DAY(),1) – with this formula, you are able to automatically calculate the average time elapsed from created to closed date at an issue level. You can then apply your filters directly in Keypup to focus on teams, projects, or any relevant segment you choose. Don’t forget to apply your filter on Issues only for this specific example. To use this specific calculation, you can leverage this Issue Lead Time for Changes template.
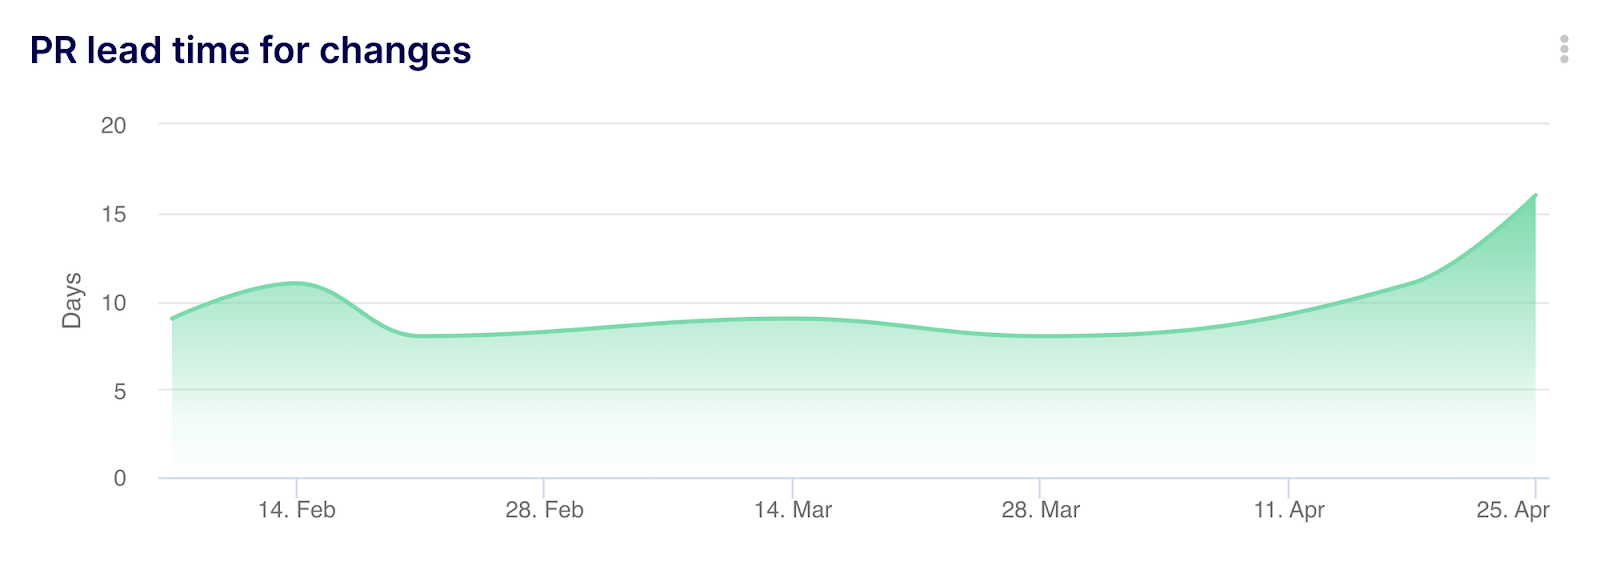
- Formula to calculate cycle time from the time a PR is opened to when it is merged: ROUND(AVG(merged_at-created_at)/DAY(),1) – with this formula, you are able to automatically calculate the average time elapsed from the PR created date to the merged date at a PR level. You can then apply your filters directly in Keypup to focus on teams, projects, or any relevant segment you choose. For this specific example, don’t forget to apply a filter at a PR level to restrict PRs where merged at is not empty. To use this specific calculation, you can leverage this PR Lead Time for Changes template.
- Formula to calculate cycle time from the time a task is assigned to a developer to when it’s associated PRs are merged: ROUND(AVG(merged_at-assigned_at)/DAY(),1) – with this formula, you are able to automatically calculate the average time elapsed from assigned date at an issue level to merged date at a PR level. You can then apply your filters directly in Keypup to focus on teams, projects, or any relevant segment you choose. You will also need to apply a filter specifying the “assigned at” field isn’t empty.
Alternatively, you could use this formula to discard blank fields: ROUND(AVG(merged_at-IF_NULL(assigned_at, created_at))/DAY(),1). To use this specific calculation, you can leverage the PR Lead Time for Changes template and simply replace the “created_at” field with the “assigned_at” field in the “Configure table” section of the advanced builder. You’ll also need to remove the filter on PR only. Note: you won’t be able to estimate the assignment date before your first connection to Keypup so we highly recommend using the previous or following option until you have enough historical data to calculate the assignment date (at least three months).
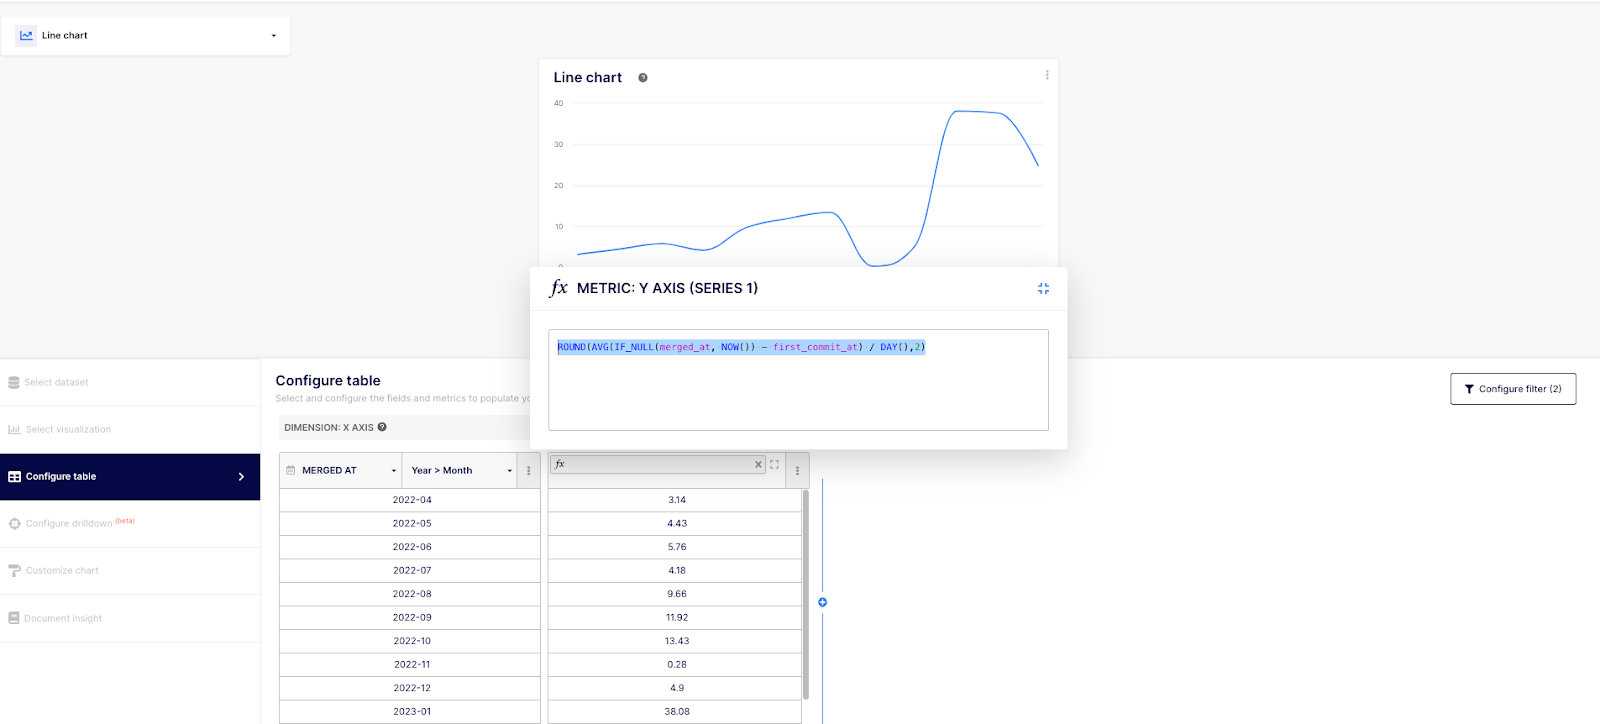
Formula to calculate cycle time from the time a first commit is made to when the PR is merged: ROUND(AVG(IF_NULL(merged_at, NOW()) - first_commit_at) / DAY(),2) – with this formula, you are able to automatically calculate the average time elapsed from the first commit date to the merged date at a PR level. You can then apply your filters directly in Keypup to focus on teams, projects, or any relevant segment you choose.
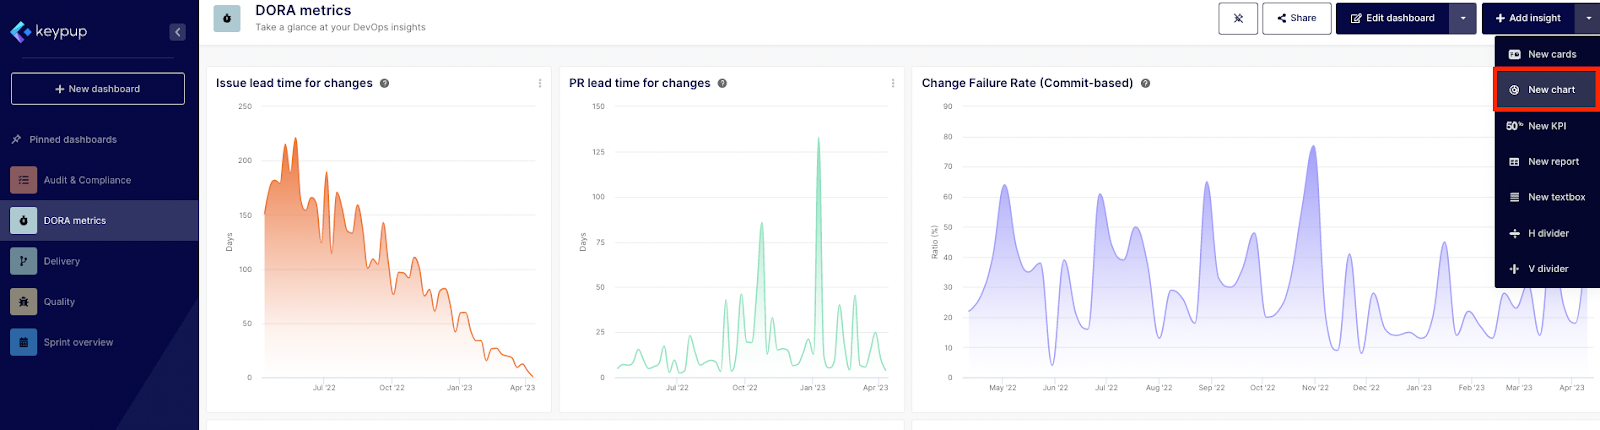
To use this specific calculation in Keypup, select one of the previous provided templates and paste the formula. Alternatively, click on the dropdown menu located near the + Add insight button in any dashboard and select “New chart”.
- Then, select the “Issues and Pull Requests” dataset.
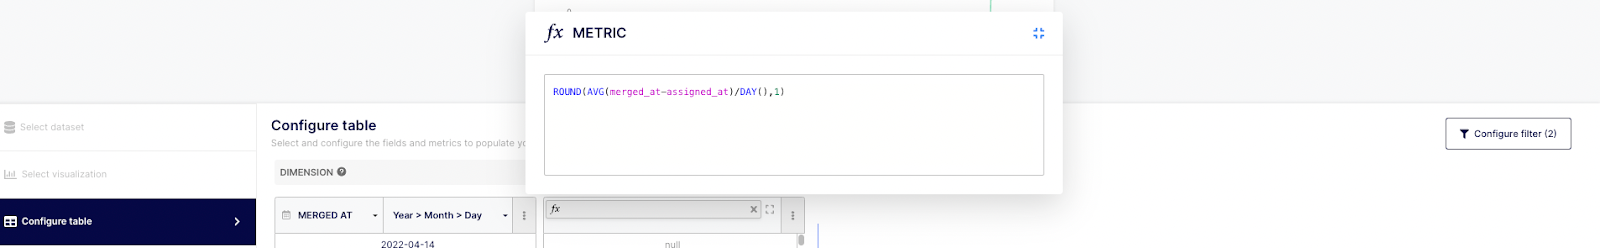
- Next, go to the “Configure table” section on the left-hand side of the modal to apply your formula. Select “fx Custom formula” at a Metric level.
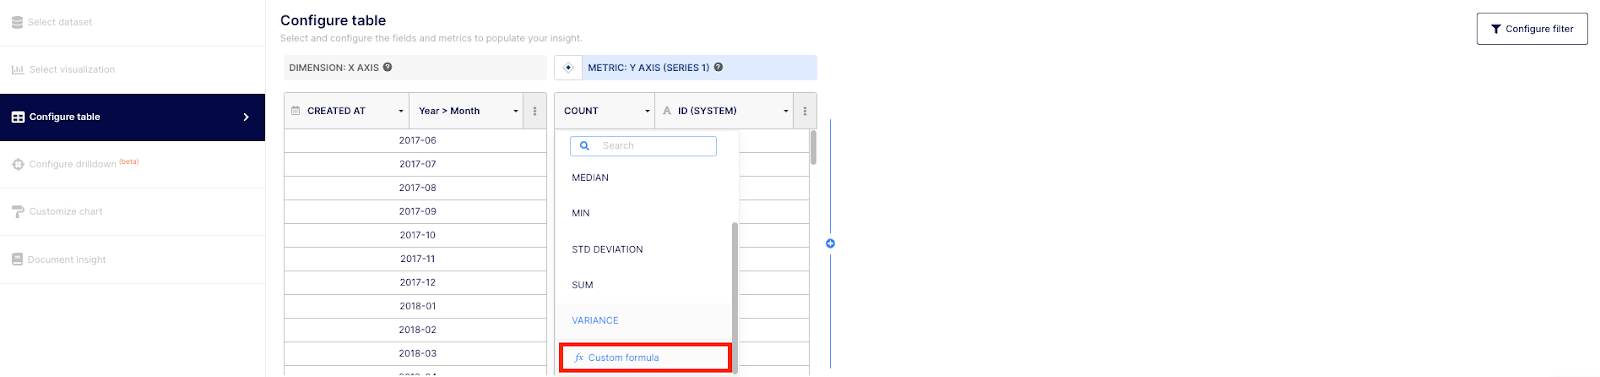
- Then, make sure to select “MERGED AT” at a dimension level and to copy/paste the formula provided earlier.
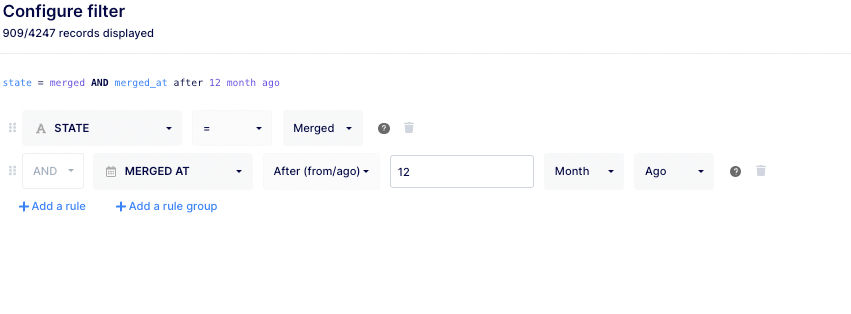
- Also, make sure to apply the filter (by clicking on the “Configure filter” button located at the right of the modal) on merged PR only and to select at least a timeframe.
- Don’t forget to rename and document your insight before saving.
Calculating Cycle Time Using Commits from Pull Requests Dataset
We will now review how to calculate the cycle time with a more granular view using the Commits from Pull Requests dataset. This option will isolate the calculation on each commit deployed to production (to be precise: merged to the production branch).
Formula to calculate cycle time from the commit creation date to when it reaches the production branch via a PR: ROUND(AVG(pull_request_merged_at - created_at)/DAY(),2).
To use this specific calculation in Keypup, click on the dropdown menu located near the + Add insight button in any dashboard and select “New chart”.
- Then, select the “Commits from pull requests” dataset.
- Next, go to the “Configure table” section on the left-hand side of the modal to apply your formula. Select “fx Custom formula” at a Metric level.
- Then, make sure to select “MERGED AT” at a dimension level and to copy/paste the formula provided earlier.
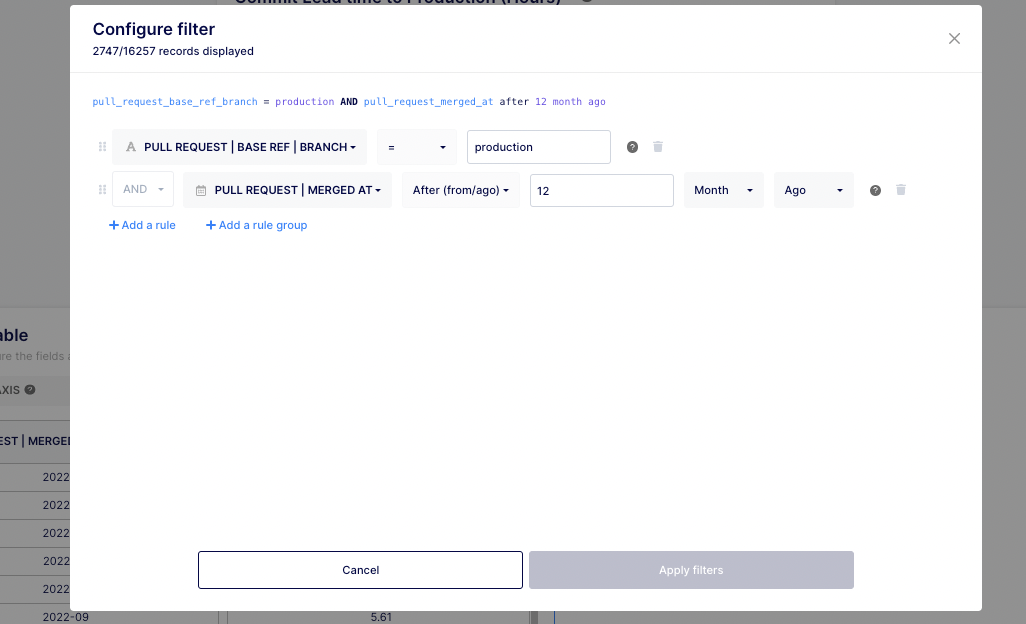
- Finally, filter your dates, projects, and authors as needed and don’t forget to filter at a branch level to include only those that hit production.
- Don’t forget to rename and document your insight before saving.
The first four examples use the PR and Issues dataset while the last one uses the Commits from PR dataset. This last dataset allows you to get a more granular view – at a commit level.
Also note that we decided to use DAYS to display the results in this example but you could replace it by HOUR, WEEK or MONTH if you wish.
Tips for Interpreting Cycle Times and Other Metrics in Software Development Analytics
Here are some tips on how to interpret cycle times and possible conclusions:
- Look for outliers: When analyzing cycle times, look for tasks that take significantly longer than average. These outliers may indicate bottlenecks or other issues in your development process that need to be addressed.
- Consider the source of delays: When analyzing cycle times, consider the source of delays. For example, if a task spends a lot of time in review, it may indicate that your code review process needs improvement.
- Compare against benchmarks: It can be helpful to compare your cycle times against industry benchmarks or against your own historical data. This can help you identify areas where you're doing well and areas where you need to improve.
- Consider the impact on customers: Ultimately, the goal of reducing cycle time is to deliver value to customers faster. Consider the impact of your cycle times on your customers and use that as motivation to improve your development process.
In addition to cycle time, there are several other metrics that can provide more granular information about your development process. Here are some examples:
- Value Stream Workload Categorization: This metric categorizes tasks based on pull request labels, enabling you to analyze how a workload is distributed and identify any irregular trends. This visualization can help optimize workload distribution, enhance team efficiency, and align development efforts with business priorities.
- Deployment Frequency: Deployment frequency measures how often you are able to deploy code changes to production. This can be a useful metric for DevOps teams.
- Code Refactoring Ratio: This metric can help ensure your team is maintaining clean and tidy code, ultimately leading to fewer bugs.
- Completed Pull Requests: This metric allows you to identify unusual deliveries such as drop or surge in merged PRs. This can help spot bottlenecks or identify process issues.
In addition to cycle time, by monitoring these metrics you can gain a more nuanced understanding of your development process and identify areas for improvement.
Take Action and Improve Your Development Process with Cycle Time Data Analysis
Here are some examples of actions you could take based on your analysis of cycle time data:
- Adjust your workflow: If you notice that certain stages in your development process are causing delays, consider adjusting your workflow to address these bottlenecks. For example, you could introduce parallel processing or automate certain tasks to reduce the time spent in these stages.
- Reassign tasks: If certain developers or teams are consistently taking longer to complete tasks, consider reassigning tasks to balance the workload or improve team efficiency. For example, you could assign certain types of tasks to developers who have particular expertise or who are able to complete them more quickly.
- Address bottlenecks: If you identify specific bottlenecks in your process (e.g., code review, testing, etc.), take action to address them. For example, you could introduce tools or processes to streamline code review or increase test automation to reduce the time spent on manual testing.
- Implement process improvements: Based on your analysis of cycle time data, identify areas where process improvements could be made. For example, you could introduce new development methodologies or tools that are designed to improve efficiency or reduce cycle time.
- Prioritize high-impact tasks: Use your analysis of cycle time data to prioritize tasks that have the greatest impact on your customers or your business. By prioritizing these tasks, you can focus your efforts on delivering the most value to your stakeholders.
Ultimately, the actions you take will depend on the specific bottlenecks or inefficiencies that you identify in your development process. By continuously monitoring your cycle time data and taking action to improve your process, you can deliver value to your customers more quickly and improve the efficiency of your development team.
Improving Cycle Time: Metrics, Analysis, and Action
The following outlines why it's important to monitor and adjust your cycle time data frequently, and incorporate metrics and KPIs gradually:
- Continuous improvement: The goal of monitoring cycle time data is to identify areas for improvement and to take action to improve your development process. However, the process of improvement is ongoing and requires continuous monitoring and adjustment. By repeating the process of monitoring and adjusting your cycle time data, you can continuously improve your development process and reduce cycle time.
- Avoiding information overload: Tech leaders should be cautious about incorporating too many metrics and KPIs at once. Incorporating too many metrics can lead to information overload and can make it difficult to identify areas for improvement. By incorporating metrics and KPIs slowly, you can focus on a few key areas for improvement and avoid spreading your resources too thin.
- Identifying cause and effect: Monitoring cycle time data over time can help you identify cause and effect relationships in your development process. For example, if you make a process improvement in one area (such as code review), you can monitor cycle time data to see if there is a corresponding improvement in cycle time. By monitoring cycle time data over time, you can gain a more nuanced understanding of your development process and make more informed decisions about where to focus your improvement efforts.
- Incorporating feedback: Finally, incorporating feedback from your team and stakeholders is an important part of the cycle time monitoring process. By incorporating feedback into your analysis of cycle time data, you can gain a better understanding of the factors that are driving cycle time and identify areas for improvement that may not be immediately obvious from the data alone.
Overall, the process of monitoring and adjusting cycle time data is a key part of the continuous improvement process for tech leaders. By incorporating metrics and KPIs slowly and repeating the process over time, you can continuously improve your development process and deliver more value to your customers.
Improving Development Process Efficiency and Effectiveness Through Cycle Time Data Analysis
In conclusion, cycle time is a crucial metric for engineering teams to measure the efficiency and effectiveness of their development process. Automating the calculation of cycle time using tools like Keypup provides a more accurate representation of the development process in real time. It also allows teams to easily identify bottlenecks and areas for improvement in their development process. When analyzing cycle time, it's important to consider outliers, the source of delays, and compare against benchmarks. Additionally, other metrics such as value stream workload categorization, deployment frequency, code refactoring ratio, and completed pull requests can provide more granular information about your development process. By continuously monitoring and adjusting cycle time data and incorporating feedback from your team and stakeholders, you can continuously improve your development process and deliver more value to your customers. Don’t wait until you have the perfect data to start improving your processes, get started with the Keypup free trial today!